0 reactions
Millixionaire Daily — Day 1 (Trading Psychology)
The Post-Sell Pump Syndrome
Rule #1 of crypto: It always pumps 10 minutes after you finally hit sell. Be honest, what was your most painful panic-sell? 📉
#crypto #millixionaire #trading #cryptomemes #web3
The Post-Sell Pump Syndrome
Rule #1 of crypto: It always pumps 10 minutes after you finally hit sell. Be honest, what was your most painful panic-sell? 📉
#crypto #millixionaire #trading #cryptomemes #web3



0 reactions
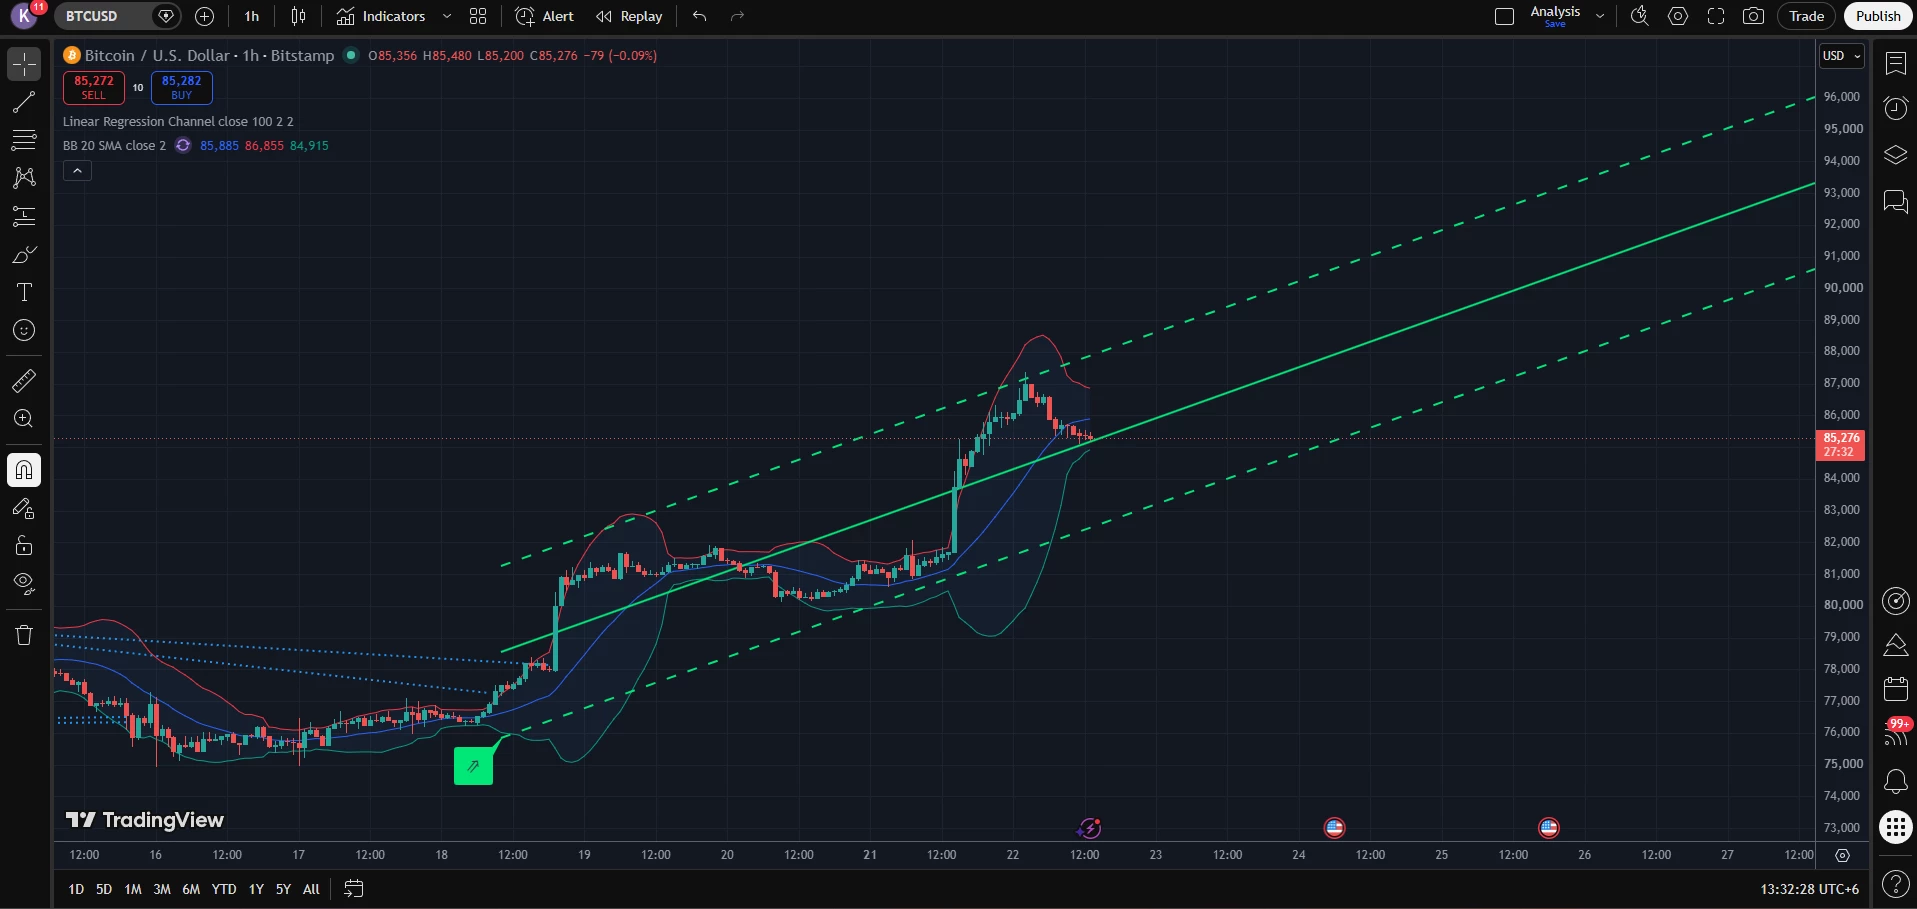
BTC/USD 1H chart and the latest macro/geopolitical information available on 22 September 2026 , here is a structured analysis.
Current chart price: ~$85,276
Key technical zones
ZoneWhat I see $86,800–87,200 Immediate resistance / recent swing high $85,800–86,000 BB midline / reclaim area $84,800–85,000 Important immediate support $83,800–84,300 Regression-channel support area $82,000–82,500 Previous breakout/consolidation zone $80,000–81,000 Major structural support
Geopolitical analysis
There are three geopolitical variables I would watch particularly closely.
🇺🇸🇮🇷 US–Iran
This is currently very important for BTC indirectly through oil → inflation → Fed → yields → risk assets .
Markets are watching the possibility of US-Iran discussions around the UN General Assembly. Oil has recently fallen sharply, although Brent rebounded to around $102 on September 22 as traders awaited developments.
The transmission mechanism is:
US-Iran tension ↓
→ oil supply risk ↓
→ inflation pressure ↓
→ Treasury yields potentially ↓
→ risk appetite ↑
→ BTC potentially benefits
But:
US-Iran escalation ↑
→ oil ↑
→ inflation expectations ↑
→ yields/Fed pressure ↑
→ risk assets potentially pressured
→ BTC can experience a sharp correction.
This is why geopolitical headlines can produce very fast BTC candles.
#BTCUSDT #Technical #Cryptocurrency #ETHUSDT #SOLUSDT #XRPUSDT #Trading
Current chart price: ~$85,276
Key technical zones
ZoneWhat I see $86,800–87,200 Immediate resistance / recent swing high $85,800–86,000 BB midline / reclaim area $84,800–85,000 Important immediate support $83,800–84,300 Regression-channel support area $82,000–82,500 Previous breakout/consolidation zone $80,000–81,000 Major structural support
Geopolitical analysis
There are three geopolitical variables I would watch particularly closely.
🇺🇸🇮🇷 US–Iran
This is currently very important for BTC indirectly through oil → inflation → Fed → yields → risk assets .
Markets are watching the possibility of US-Iran discussions around the UN General Assembly. Oil has recently fallen sharply, although Brent rebounded to around $102 on September 22 as traders awaited developments.
The transmission mechanism is:
US-Iran tension ↓
→ oil supply risk ↓
→ inflation pressure ↓
→ Treasury yields potentially ↓
→ risk appetite ↑
→ BTC potentially benefits
But:
US-Iran escalation ↑
→ oil ↑
→ inflation expectations ↑
→ yields/Fed pressure ↑
→ risk assets potentially pressured
→ BTC can experience a sharp correction.
This is why geopolitical headlines can produce very fast BTC candles.
#BTCUSDT #Technical #Cryptocurrency #ETHUSDT #SOLUSDT #XRPUSDT #Trading
0 reactions
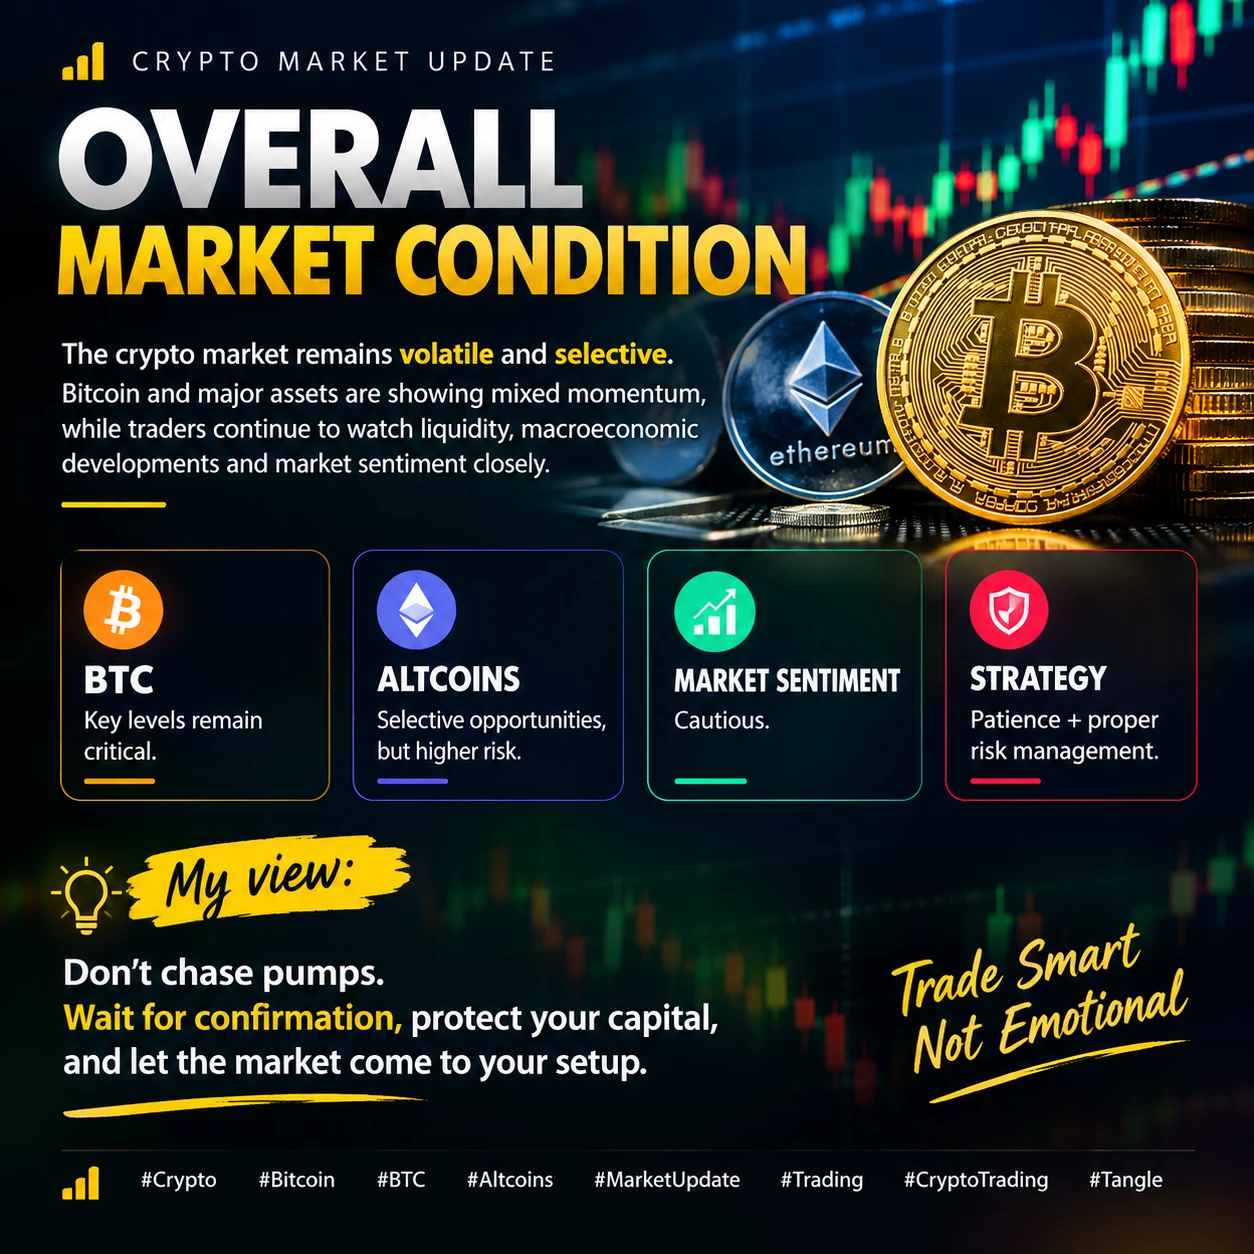
📊 OVERALL MARKET CONDITION
The crypto market remains volatile and selective . ⚡️
Bitcoin and major assets are showing mixed momentum, while traders continue to watch liquidity, macroeconomic developments and market sentiment closely. 📈📉
🔹 BTC: Key levels remain critical
🔹 Altcoins: Selective opportunities, but higher risk
🔹 Market sentiment: Cautious
🔹 Strategy: Patience + proper risk management 🛡️
💡 My view: Don’t chase pumps. Wait for confirmation, protect your capital, and let the market come to your setup.
#Crypto #Bitcoin #BTC #Altcoins #MarketUpdate #Trading #CryptoTrading #Tangle