Cardano (ADA) Price Rally Is Far From Over, Here’s Why
Cardano (ADA) has notably trailed behind that of its contemporaries in the ongoing crypto bull run. While Bitcoin has surged to record new all-time highs , alongside a suite of other altcoins, ADA remains approximately 77% beneath its peak historical value. However, emerging technical patterns and market dynamics suggest that this trend could be poised for a reversal, with ADA potentially gearing up to narrow the gap.
Cardano Bull Flag Formation: An In-Depth Look
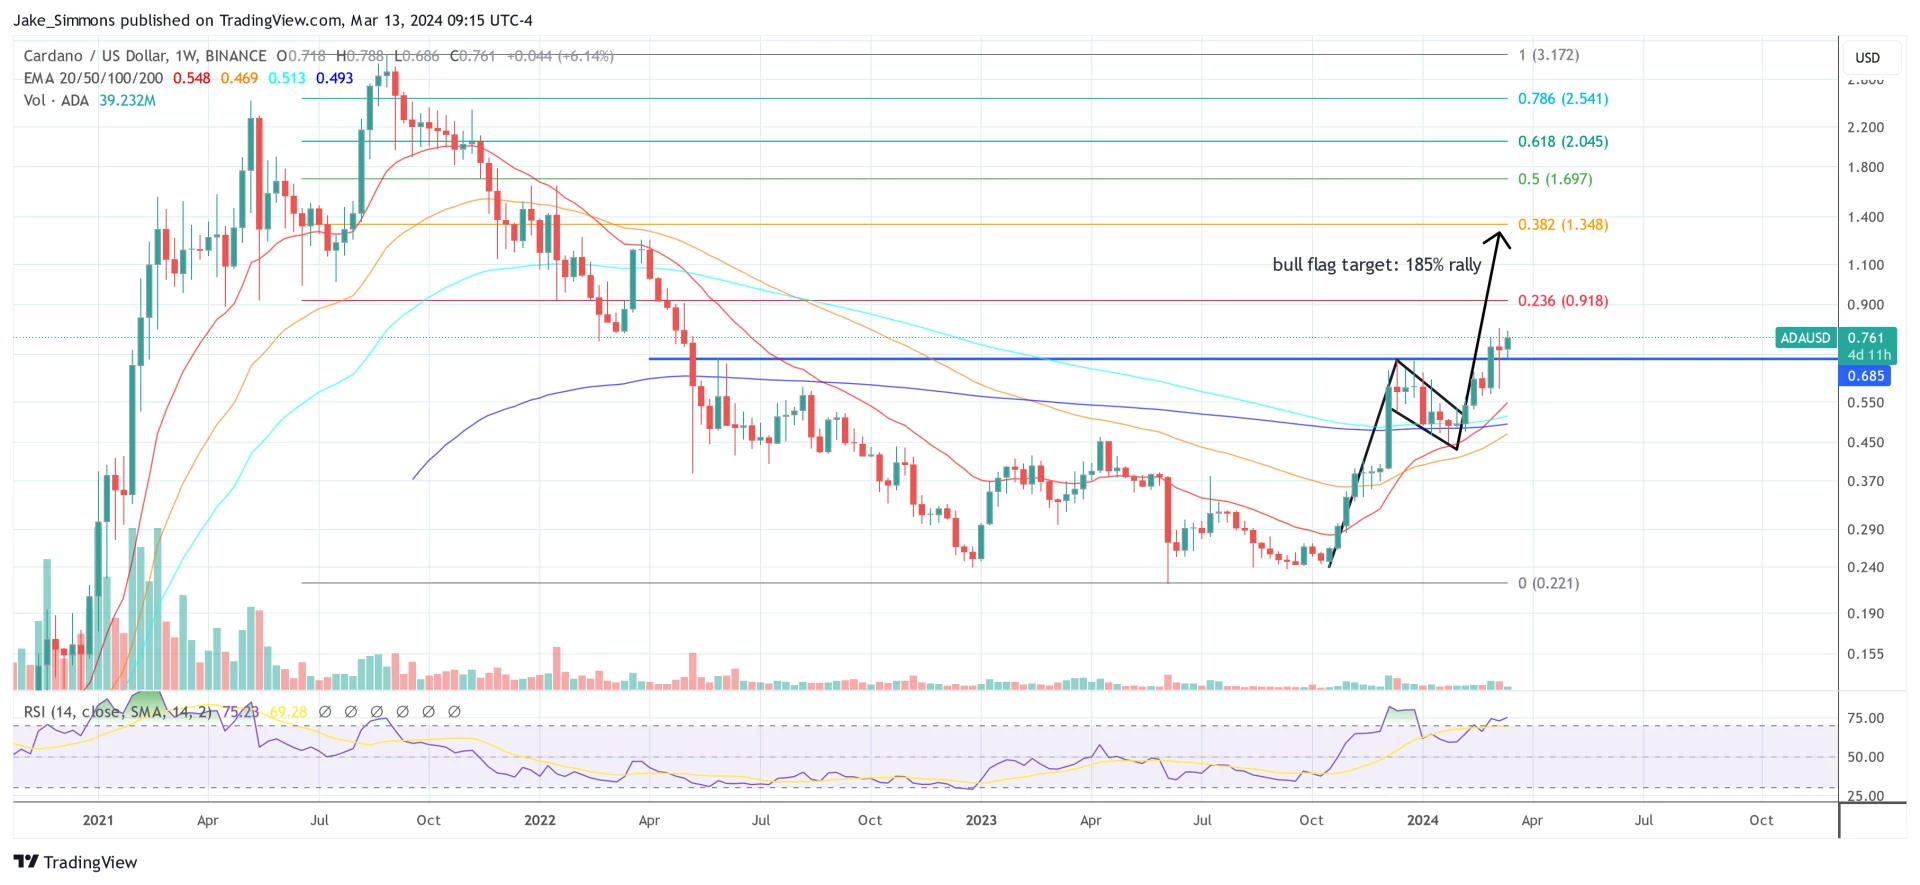
Central to this analysis is the bull flag pattern in the ADA/USD weekly chart. The bull flag pattern observed here is composed of two primary elements: the flagpole and the flag. The flagpole is a significant vertical ascent in price, representing a rapid increase in buying pressure. For ADA, this pole formed from mid-October till mid-December and reflects an approximate 185% surge.
The flag, following the pole, is a period of consolidation with a downward slope, resembling a flag on a pole. For ADA, the pole developed from mid-December to early February. A subsequent breakout above the flag can often lead to a price rally proportionate to the initial pole’s height.
The Cardano price already broke out and surpassed the crucial resistance at $0.685. If ADA further follows this technical playbook, the rally is far from over. The projected target would be an 185% increase from the consolidation zone’s breakout point, placing the price close to the Fibonacci 0.382 retracement level, which is around $1.35.
Remarkably, the Cardano price must first overcome the 0.236 Fibonacci retracement level at $0.92, an area where greater selling pressure and possibly a shorter consolidation can be expected.
Read More: https://www.newsbtc.com/news/cardano/cardano-ada-price-rally-is-far-from-over/
Cardano (ADA) has notably trailed behind that of its contemporaries in the ongoing crypto bull run. While Bitcoin has surged to record new all-time highs , alongside a suite of other altcoins, ADA remains approximately 77% beneath its peak historical value. However, emerging technical patterns and market dynamics suggest that this trend could be poised for a reversal, with ADA potentially gearing up to narrow the gap.
Cardano Bull Flag Formation: An In-Depth Look
Central to this analysis is the bull flag pattern in the ADA/USD weekly chart. The bull flag pattern observed here is composed of two primary elements: the flagpole and the flag. The flagpole is a significant vertical ascent in price, representing a rapid increase in buying pressure. For ADA, this pole formed from mid-October till mid-December and reflects an approximate 185% surge.
The flag, following the pole, is a period of consolidation with a downward slope, resembling a flag on a pole. For ADA, the pole developed from mid-December to early February. A subsequent breakout above the flag can often lead to a price rally proportionate to the initial pole’s height.
The Cardano price already broke out and surpassed the crucial resistance at $0.685. If ADA further follows this technical playbook, the rally is far from over. The projected target would be an 185% increase from the consolidation zone’s breakout point, placing the price close to the Fibonacci 0.382 retracement level, which is around $1.35.
Remarkably, the Cardano price must first overcome the 0.236 Fibonacci retracement level at $0.92, an area where greater selling pressure and possibly a shorter consolidation can be expected.
Read More: https://www.newsbtc.com/news/cardano/cardano-ada-price-rally-is-far-from-over/
0
0
0
1
| 11,000 mlx | |
| 15 | |
| 1 |