23 reactions
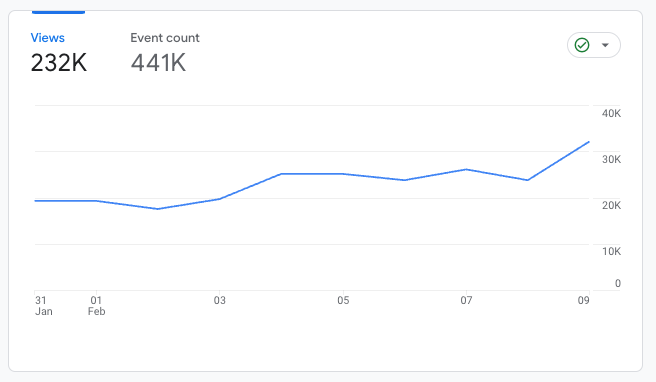
@SeattleJohn asked from some traffic patterns. Here is a chart showing Tangled Social page views per day from January 31. It shows two things that aren't normally seen: 50% growth in 9 days and no significant drop in traffic on weekends. I'll keep looking for actionable intel to share that could help people post the right thing at the right time for max engagement.


16

1
| 83,000 mlx | |
| 192 | |
| 23 |