If you were read my message Daily 1000 dollars. Chapter 1…

1 reactions
If you were read my message Daily 1000 dollars.
Chapter 1: 2;3;4 it's mean you want to earn daily 1000 dollars.today discussion technical skills.
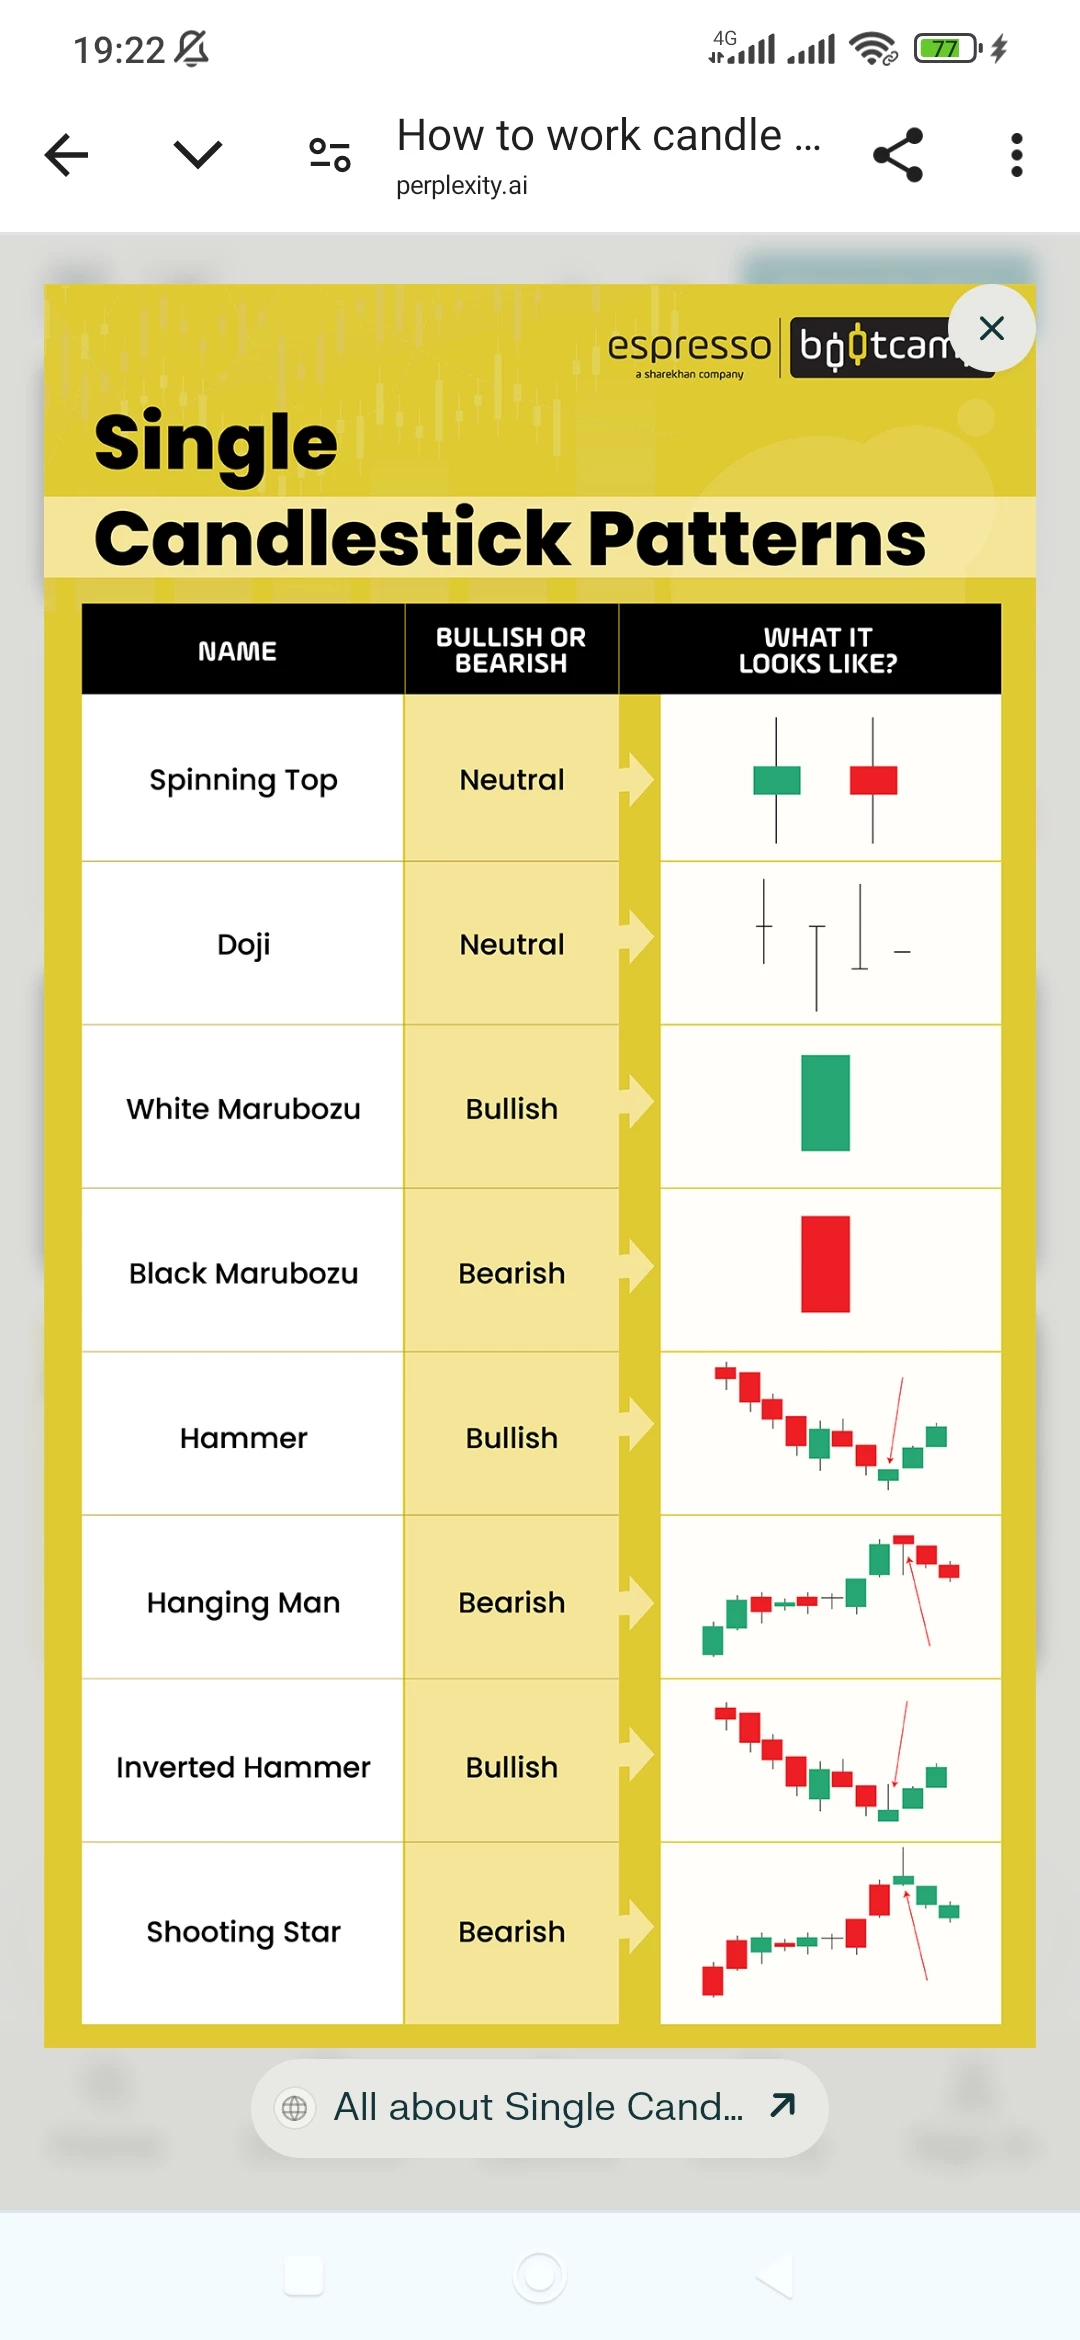
Candlestick patterns provide visual cues for identifying potential reversals, continuations, and market sentiment shifts in futures trading. Here’s a structured approach to applying them effectively:---
## **Key Candlestick Patterns for Futures Trading**
### **Bullish Reversal Patterns**
1. **Bullish Engulfing**
- **Structure**: A small bearish candle followed by a larger bullish candle that completely engulfs the first candle’s body.
- **Signal**: Indicates strong buying pressure, often marking the end of a downtrend[1][2].
- **Confirmation**: A subsequent bullish candle confirms the reversal.
2. **Morning Star**
- **Structure**: A bearish candle, followed by a small-bodied candle (or doji), then a strong bullish candle.
- **Signal**: Suggests a shift from bearish to bullish momentum at the bottom of a downtrend[1][3].
- **Confirmation**: The third candle must close above the midpoint of the first bearish candle[3].
3. **Hammer**
- **Structure**: A small body with a long lower wick, resembling a hammer.
- **Signal**: Indicates rejection of lower prices, hinting at a potential uptrend[2][4].
- **Confirmation**: A bullish candle the next day validates the reversal.
### **Bearish Reversal Patterns**
1. **Bearish Engulfing**
- **Structure**: A small bullish candle engulfed by a larger bearish candle.
- **Signal**: Signals weakening buying pressure and potential downtrend[2][4].
2. **Evening Star**
- **Structure**: A bullish candle, followed by a small-bodied candle (or doji), then a strong bearish candle.
- **Signal**: Marks the end of an uptrend, especially when the third candle erases the first candle’s gains[4].
3. **Shooting Star**
- **Structure**: A small body with a long upper wick, resembling an inverted hammer.
- **Signal**: Indicates rejection of higher prices, suggesting a potential downtrend[2][4].
### **Continuation Patterns**
1. **Rising Three Methods**
- **Structure**: A strong bullish candle, followed by three small bearish candles within its range, then another bullish candle.
- **Signal**: Confirms buyers retain control during a consolidation phase[1][4].
2. **Falling Three Methods**
- **Structure**: A strong bearish candle, followed by three small bullish candles within its range, then another bearish candle.
- **Signal**: Reflects sustained selling pressure during a consolidation[4].
---
## **Practical Application in Futures Trading**
1. **Identify Context**
- Look for patterns at key levels (e.g., support/resistance, trendlines) to gauge their significance.
- Example: A **bullish engulfing** at a support level may signal a reversal.
2. **Confirm with Momentum Indicators**
- Pair patterns with tools like RSI or MACD to filter false signals.
3. **Risk Management**
- Place stop-losses below the low of a bullish reversal pattern (e.g., hammer) or above the high of a bearish reversal (e.g., shooting star).
4. **Avoid Overtrading**
- Focus on high-probability patterns (e.g., morning star doji, which has a **68% success rate** in predicting reversals[3])
## **Limitations**
Candlestick patterns alone are not foolproof. Combine them with volume analysis, trend direction, and broader market conditions for robust trading decisions[2][7].
By integrating these patterns into a disciplined strategy, futures traders can enhance their ability to anticipate price movements and manage risk effective
Chapter 1: 2;3;4 it's mean you want to earn daily 1000 dollars.today discussion technical skills.
Candlestick patterns provide visual cues for identifying potential reversals, continuations, and market sentiment shifts in futures trading. Here’s a structured approach to applying them effectively:---
## **Key Candlestick Patterns for Futures Trading**
### **Bullish Reversal Patterns**
1. **Bullish Engulfing**
- **Structure**: A small bearish candle followed by a larger bullish candle that completely engulfs the first candle’s body.
- **Signal**: Indicates strong buying pressure, often marking the end of a downtrend[1][2].
- **Confirmation**: A subsequent bullish candle confirms the reversal.
2. **Morning Star**
- **Structure**: A bearish candle, followed by a small-bodied candle (or doji), then a strong bullish candle.
- **Signal**: Suggests a shift from bearish to bullish momentum at the bottom of a downtrend[1][3].
- **Confirmation**: The third candle must close above the midpoint of the first bearish candle[3].
3. **Hammer**
- **Structure**: A small body with a long lower wick, resembling a hammer.
- **Signal**: Indicates rejection of lower prices, hinting at a potential uptrend[2][4].
- **Confirmation**: A bullish candle the next day validates the reversal.
### **Bearish Reversal Patterns**
1. **Bearish Engulfing**
- **Structure**: A small bullish candle engulfed by a larger bearish candle.
- **Signal**: Signals weakening buying pressure and potential downtrend[2][4].
2. **Evening Star**
- **Structure**: A bullish candle, followed by a small-bodied candle (or doji), then a strong bearish candle.
- **Signal**: Marks the end of an uptrend, especially when the third candle erases the first candle’s gains[4].
3. **Shooting Star**
- **Structure**: A small body with a long upper wick, resembling an inverted hammer.
- **Signal**: Indicates rejection of higher prices, suggesting a potential downtrend[2][4].
### **Continuation Patterns**
1. **Rising Three Methods**
- **Structure**: A strong bullish candle, followed by three small bearish candles within its range, then another bullish candle.
- **Signal**: Confirms buyers retain control during a consolidation phase[1][4].
2. **Falling Three Methods**
- **Structure**: A strong bearish candle, followed by three small bullish candles within its range, then another bearish candle.
- **Signal**: Reflects sustained selling pressure during a consolidation[4].
---
## **Practical Application in Futures Trading**
1. **Identify Context**
- Look for patterns at key levels (e.g., support/resistance, trendlines) to gauge their significance.
- Example: A **bullish engulfing** at a support level may signal a reversal.
2. **Confirm with Momentum Indicators**
- Pair patterns with tools like RSI or MACD to filter false signals.
3. **Risk Management**
- Place stop-losses below the low of a bullish reversal pattern (e.g., hammer) or above the high of a bearish reversal (e.g., shooting star).
4. **Avoid Overtrading**
- Focus on high-probability patterns (e.g., morning star doji, which has a **68% success rate** in predicting reversals[3])
## **Limitations**
Candlestick patterns alone are not foolproof. Combine them with volume analysis, trend direction, and broader market conditions for robust trading decisions[2][7].
By integrating these patterns into a disciplined strategy, futures traders can enhance their ability to anticipate price movements and manage risk effective


1
| 4,000 mlx | |
| 4 | |
| 1 |