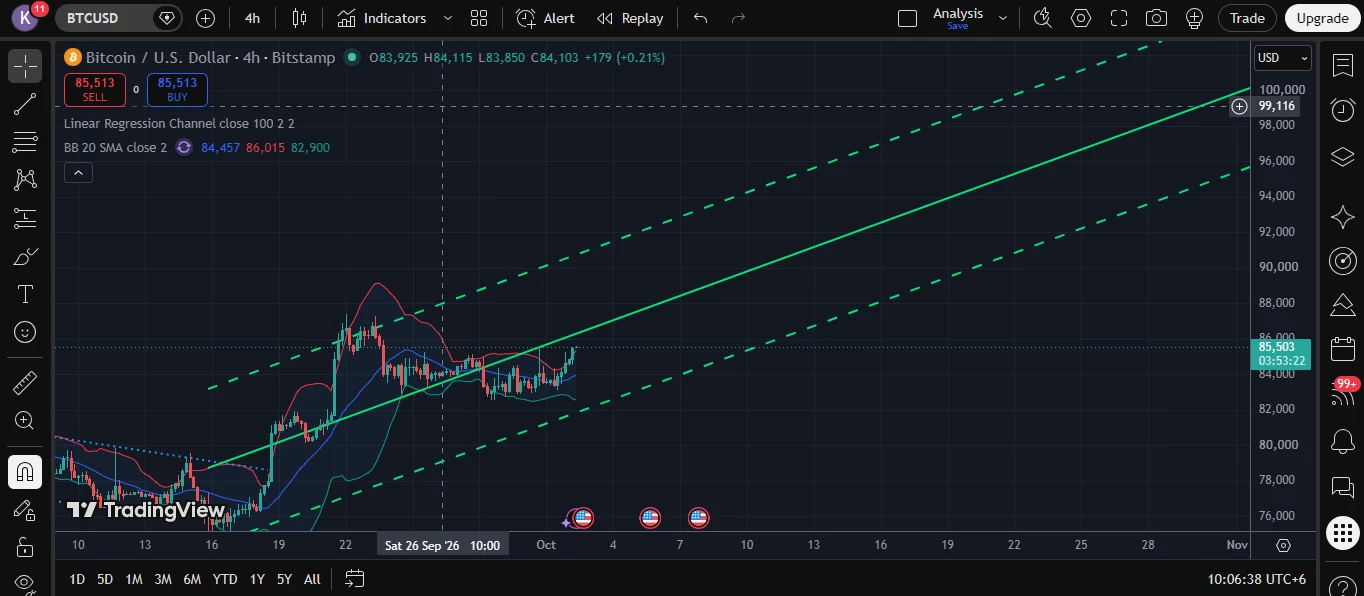
BTC/USD 4H Analysis Current price: ~ $85,503 The most…

0 reactions
BTC/USD 4H Analysis
Current price: ~ $85,503
The most important resistance: $86K–87K
Your upper Bollinger Band is around:
$86,015
And the previous major swing high is around:
$87K
So this creates a very important resistance zone:
$86K–87K
If BTC gets a 4H close above $86K , that would be an important improvement.
If it then breaks and holds above ~$87K, the previous high would be cleared.
Linear Regression Channel
This is the strongest bullish feature on your chart.
The channel is clearly rising.
BTC is currently moving from the lower/middle portion of the channel toward the upper portion.
That means the broader 4H trend has not been broken .
However, notice something important:
BTC is approaching the upper Bollinger Band and the previous ~$87K high at almost the same time.
That creates a confluence resistance zone .
So $86K–87K is more important than simply looking at the Bollinger Band by itself.
Macro / Geopolitical situation
This part is particularly important today, October 2 .
BTC briefly moved above $85K after softer-than-expected U.S. inflation data, but the move faded because Treasury yields remained very high. CoinDesk reported the U.S. 10-year yield around 5.28% , while BTC was back around $83.7K at that point.
And today's macro backdrop is still challenging:
U.S. 10-year Treasury yield recently reached around 5.34% , the highest since 2002.
DXY is around 102 and has been rising.
Brent is around $102–103 .
Oil is being affected by continued US-Iran tensions and supply concerns.
This creates a very important conflict:
BTC-positive
Cooler inflation
→ Lower expectations of another Fed hike
→ Potentially lower yields
→ Risk assets can benefit
BTC-negative
Iran/Middle East tensions
→ Oil ↑
→ Inflation pressure ↑
→ Treasury yields ↑
→ Dollar ↑
→ Risk assets face pressure
#BTCUSDT #ETHUSDT #BNBUSDT #DOGEUSDT #PIUSDT
Current price: ~ $85,503
The most important resistance: $86K–87K
Your upper Bollinger Band is around:
$86,015
And the previous major swing high is around:
$87K
So this creates a very important resistance zone:
$86K–87K
If BTC gets a 4H close above $86K , that would be an important improvement.
If it then breaks and holds above ~$87K, the previous high would be cleared.
Linear Regression Channel
This is the strongest bullish feature on your chart.
The channel is clearly rising.
BTC is currently moving from the lower/middle portion of the channel toward the upper portion.
That means the broader 4H trend has not been broken .
However, notice something important:
BTC is approaching the upper Bollinger Band and the previous ~$87K high at almost the same time.
That creates a confluence resistance zone .
So $86K–87K is more important than simply looking at the Bollinger Band by itself.
Macro / Geopolitical situation
This part is particularly important today, October 2 .
BTC briefly moved above $85K after softer-than-expected U.S. inflation data, but the move faded because Treasury yields remained very high. CoinDesk reported the U.S. 10-year yield around 5.28% , while BTC was back around $83.7K at that point.
And today's macro backdrop is still challenging:
U.S. 10-year Treasury yield recently reached around 5.34% , the highest since 2002.
DXY is around 102 and has been rising.
Brent is around $102–103 .
Oil is being affected by continued US-Iran tensions and supply concerns.
This creates a very important conflict:
BTC-positive
Cooler inflation
→ Lower expectations of another Fed hike
→ Potentially lower yields
→ Risk assets can benefit
BTC-negative
Iran/Middle East tensions
→ Oil ↑
→ Inflation pressure ↑
→ Treasury yields ↑
→ Dollar ↑
→ Risk assets face pressure
#BTCUSDT #ETHUSDT #BNBUSDT #DOGEUSDT #PIUSDT


| 1,000 mlx | |
| 2 | |
| 0 |