6
0
3
3
12
12

0 reactions
BTC/USD 4H Analysis
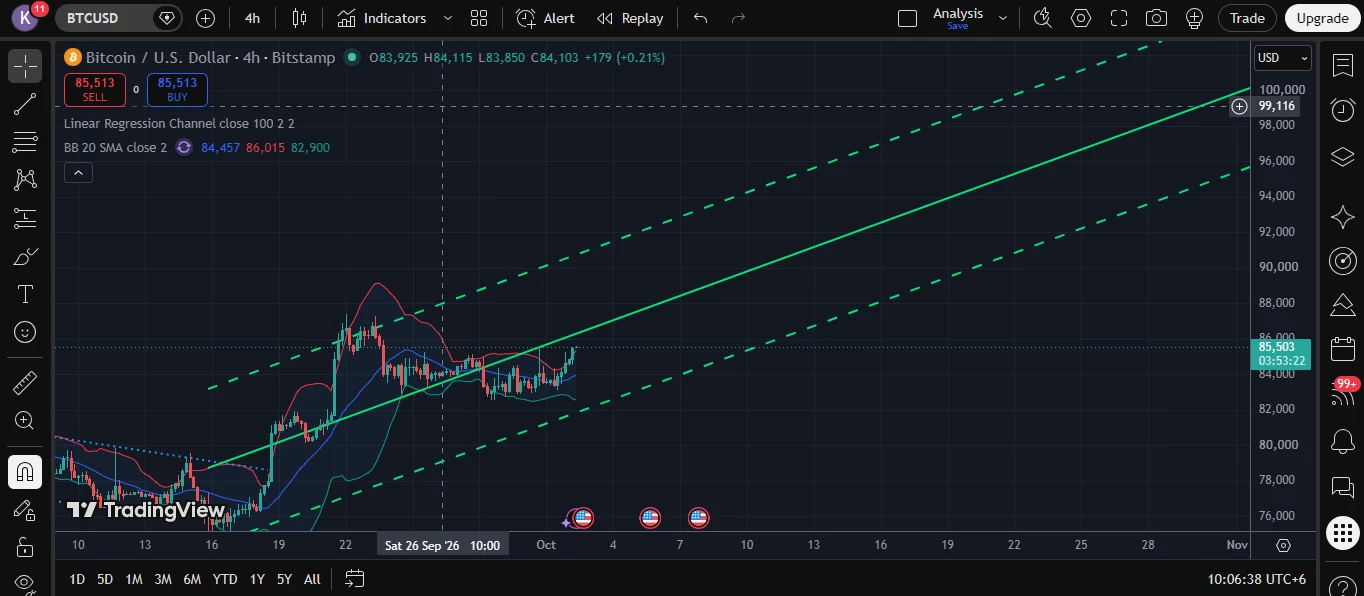
Current price: ~ $85,503
The most important resistance: $86K–87K
Your upper Bollinger Band is around:
$86,015
And the previous major swing high is around:
$87K
So this creates a very important resistance zone:
$86K–87K
If BTC gets a 4H close above $86K , that would be an important improvement.
If it then breaks and holds above ~$87K, the previous high would be cleared.
Linear Regression Channel
This is the strongest bullish feature on your chart.
The channel is clearly rising.
BTC is currently moving from the lower/middle portion of the channel toward the upper portion.
That means the broader 4H trend has not been broken .
However, notice something important:
BTC is approaching the upper Bollinger Band and the previous ~$87K high at almost the same time.
That creates a confluence resistance zone .
So $86K–87K is more important than simply looking at the Bollinger Band by itself.
Macro / Geopolitical situation
This part is particularly important today, October 2 .
BTC briefly moved above $85K after softer-than-expected U.S. inflation data, but the move faded because Treasury yields remained very high. CoinDesk reported the U.S. 10-year yield around 5.28% , while BTC was back around $83.7K at that point.
And today's macro backdrop is still challenging:
U.S. 10-year Treasury yield recently reached around 5.34% , the highest since 2002.
DXY is around 102 and has been rising.
Brent is around $102–103 .
Oil is being affected by continued US-Iran tensions and supply concerns.
This creates a very important conflict:
BTC-positive
Cooler inflation
→ Lower expectations of another Fed hike
→ Potentially lower yields
→ Risk assets can benefit
BTC-negative
Iran/Middle East tensions
→ Oil ↑
→ Inflation pressure ↑
→ Treasury yields ↑
→ Dollar ↑
→ Risk assets face pressure
#BTCUSDT #ETHUSDT #BNBUSDT #DOGEUSDT #PIUSDT
Current price: ~ $85,503
The most important resistance: $86K–87K
Your upper Bollinger Band is around:
$86,015
And the previous major swing high is around:
$87K
So this creates a very important resistance zone:
$86K–87K
If BTC gets a 4H close above $86K , that would be an important improvement.
If it then breaks and holds above ~$87K, the previous high would be cleared.
Linear Regression Channel
This is the strongest bullish feature on your chart.
The channel is clearly rising.
BTC is currently moving from the lower/middle portion of the channel toward the upper portion.
That means the broader 4H trend has not been broken .
However, notice something important:
BTC is approaching the upper Bollinger Band and the previous ~$87K high at almost the same time.
That creates a confluence resistance zone .
So $86K–87K is more important than simply looking at the Bollinger Band by itself.
Macro / Geopolitical situation
This part is particularly important today, October 2 .
BTC briefly moved above $85K after softer-than-expected U.S. inflation data, but the move faded because Treasury yields remained very high. CoinDesk reported the U.S. 10-year yield around 5.28% , while BTC was back around $83.7K at that point.
And today's macro backdrop is still challenging:
U.S. 10-year Treasury yield recently reached around 5.34% , the highest since 2002.
DXY is around 102 and has been rising.
Brent is around $102–103 .
Oil is being affected by continued US-Iran tensions and supply concerns.
This creates a very important conflict:
BTC-positive
Cooler inflation
→ Lower expectations of another Fed hike
→ Potentially lower yields
→ Risk assets can benefit
BTC-negative
Iran/Middle East tensions
→ Oil ↑
→ Inflation pressure ↑
→ Treasury yields ↑
→ Dollar ↑
→ Risk assets face pressure
#BTCUSDT #ETHUSDT #BNBUSDT #DOGEUSDT #PIUSDT


0 reactions
BTC/USD 1H — Updated Technical + Macro Analysis
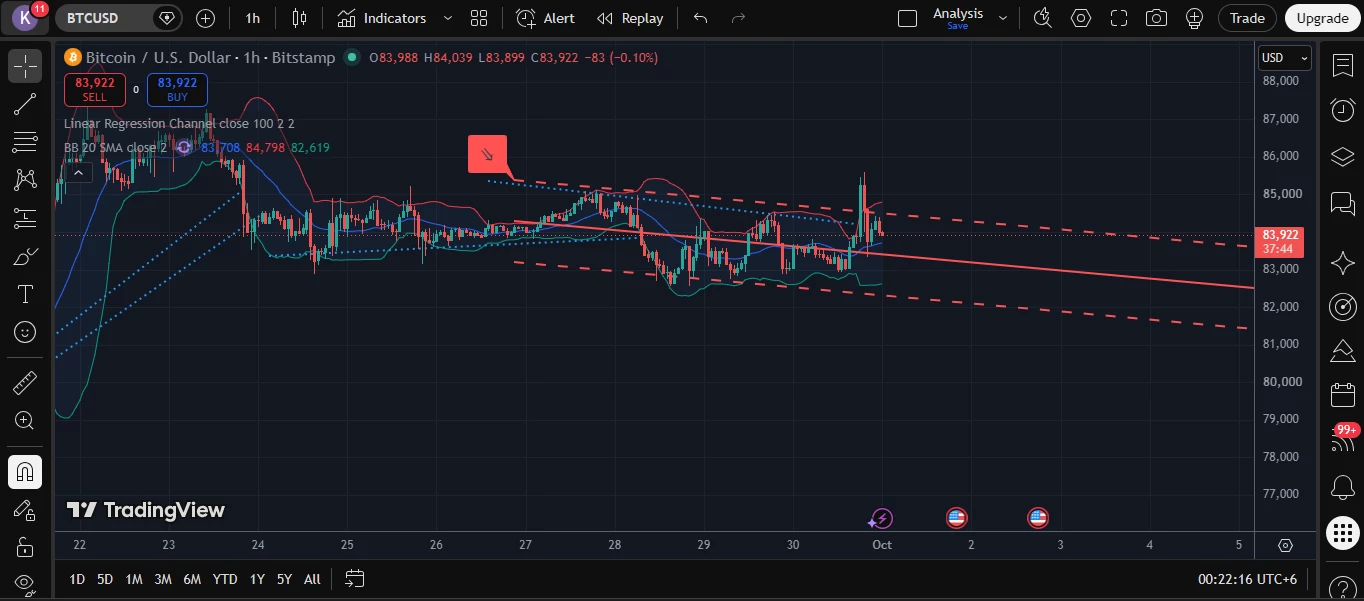
Current price: ~ $83,922
Short-term trend: Bearish/neutral
Your red descending channel is the most important feature now.
BTC has been making roughly:
$85K → $83K → $84.5K → $83K → $85.5K → $83.9K
So there is significant volatility, but the short-term structure is still characterized by lower highs .
The recent spike toward $85.5K was rejected and price returned toward $84K.
Therefore:
1H short-term trend = bearish/neutral
🟢 Bullish scenario
I would want to see:
$83.7K holds
↓
BTC breaks the descending red trendline
↓
$84.8K reclaimed
↓
$85K
↓
$85.5K
↓
Potentially $86K+
The important part is not simply touching $85K .
A stronger signal would be:
Break → close → retest → hold
🔴 Bearish scenario
If BTC loses:
$82.6K
with a convincing 1H close below it:
Then:
$82K
becomes the first area to watch.
Below that:
$81K → $80K
The bearish case becomes considerably stronger if BTC starts producing lower highs + lower lows below the descending channel.
Macro/geopolitical situation is mixed
This is particularly interesting today.
Recent U.S. inflation data was cooler than expected , and that reduced expectations of an October Fed hike. Reuters reported that the dollar weakened and Treasury yields fell after the PCE data; markets were assigning about a 35% probability to an October hike, down from roughly 70% the prior week.
That is potentially supportive for BTC .
🎯 My current reading
Short-term 1H:
Bearish/neutral
Medium structure:
Still potentially constructive as long as $80K–82K holds
Immediate battle:
$83.7K vs $84.8K
Major downside level:
$82.6K
Major upside confirmation:
$84.8K + descending-channel breakout
#BTCUSDT #ETHUSDT #BNBUSDT #DOGEUSDT #PIUSDT
Current price: ~ $83,922
Short-term trend: Bearish/neutral
Your red descending channel is the most important feature now.
BTC has been making roughly:
$85K → $83K → $84.5K → $83K → $85.5K → $83.9K
So there is significant volatility, but the short-term structure is still characterized by lower highs .
The recent spike toward $85.5K was rejected and price returned toward $84K.
Therefore:
1H short-term trend = bearish/neutral
🟢 Bullish scenario
I would want to see:
$83.7K holds
↓
BTC breaks the descending red trendline
↓
$84.8K reclaimed
↓
$85K
↓
$85.5K
↓
Potentially $86K+
The important part is not simply touching $85K .
A stronger signal would be:
Break → close → retest → hold
🔴 Bearish scenario
If BTC loses:
$82.6K
with a convincing 1H close below it:
Then:
$82K
becomes the first area to watch.
Below that:
$81K → $80K
The bearish case becomes considerably stronger if BTC starts producing lower highs + lower lows below the descending channel.
Macro/geopolitical situation is mixed
This is particularly interesting today.
Recent U.S. inflation data was cooler than expected , and that reduced expectations of an October Fed hike. Reuters reported that the dollar weakened and Treasury yields fell after the PCE data; markets were assigning about a 35% probability to an October hike, down from roughly 70% the prior week.
That is potentially supportive for BTC .
🎯 My current reading
Short-term 1H:
Bearish/neutral
Medium structure:
Still potentially constructive as long as $80K–82K holds
Immediate battle:
$83.7K vs $84.8K
Major downside level:
$82.6K
Major upside confirmation:
$84.8K + descending-channel breakout
#BTCUSDT #ETHUSDT #BNBUSDT #DOGEUSDT #PIUSDT
0 reactions
BTC/USD 1H — Updated Analysis
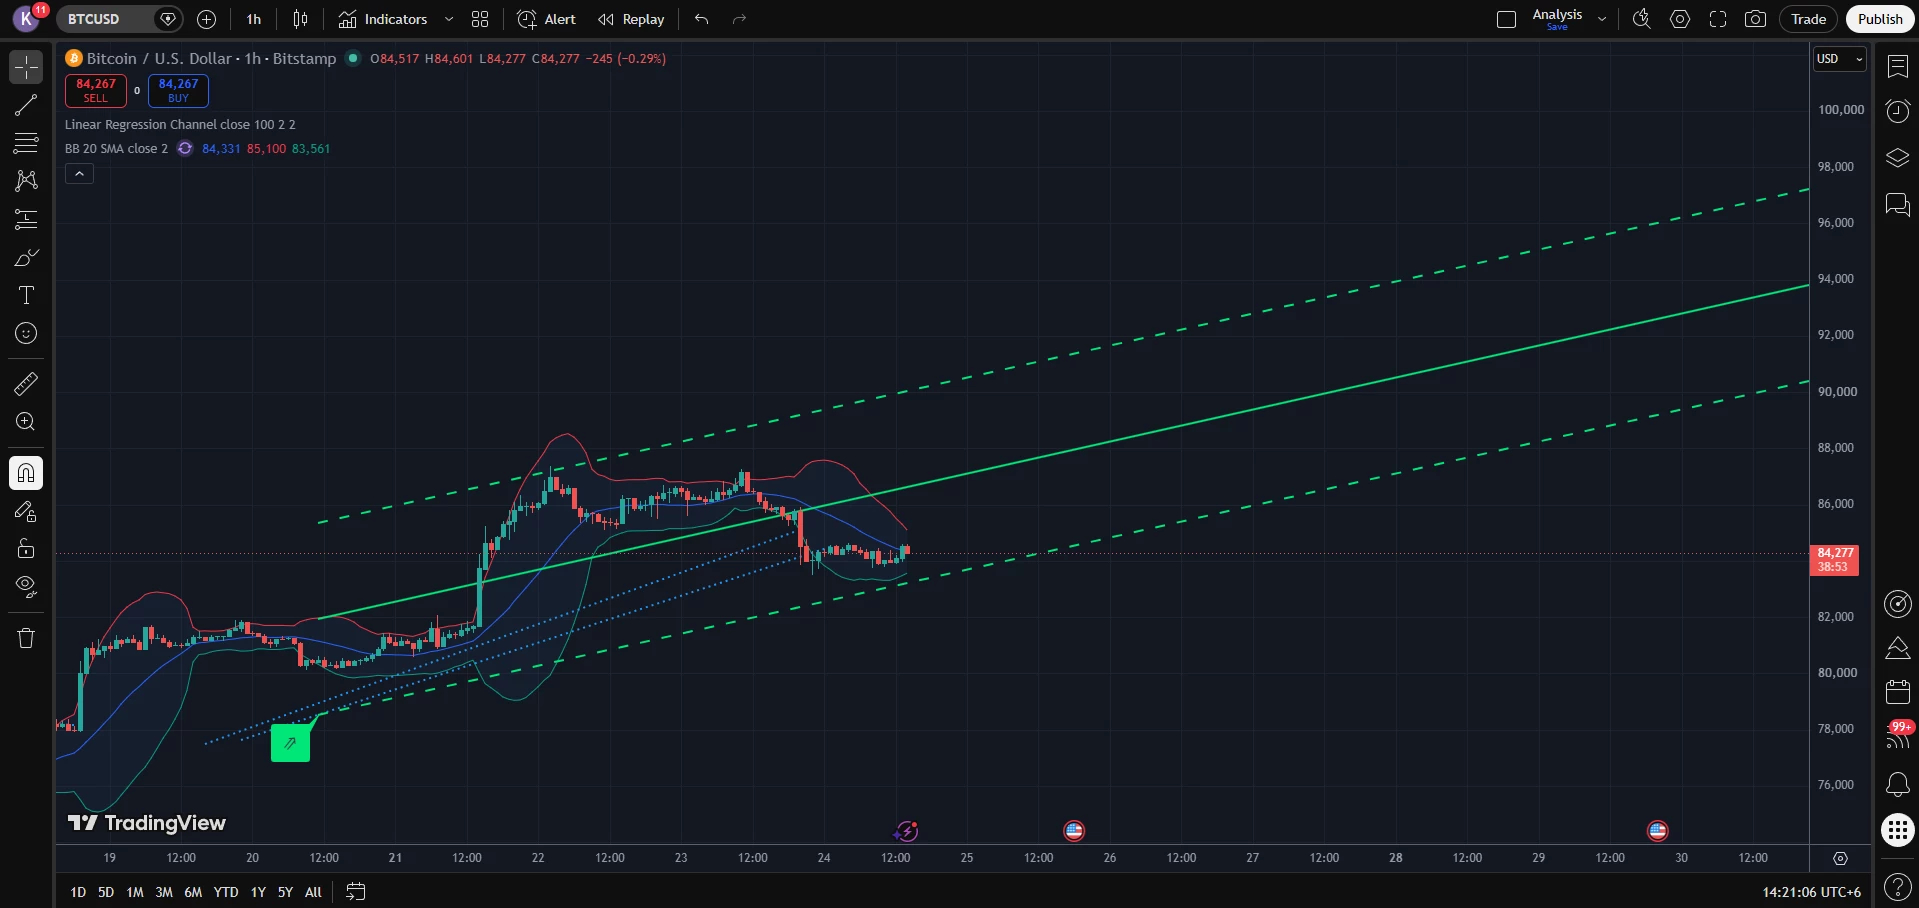
Current price: ~$84,277
Bollinger Bands:
Middle: ~$84,331
Upper: ~$85,100
Lower: ~$83,561
Short-term momentum has weakened
BTC is now slightly below the Bollinger middle band .
That is a change from your previous chart, where BTC was above the middle band.
So short-term momentum has shifted from:
Bullish → Neutral/Bearish
But price is still above the lower Bollinger Band.
Therefore, this is not yet a confirmed major breakdown .
Why did BTC fall from $87K?
This move is not happening in isolation.
BTC reached around $87.3K before pulling back. Recent market reporting links the pullback to rising U.S. Treasury yields, increased expectations for another Fed rate hike, and renewed oil/geopolitical concerns.
This is important because your chart is showing exactly what we would expect from a macro-driven correction:
$87K rejection
↓
risk-off pressure
↓
BTC falls toward $84K
#BTCUSDT #ETHUSDT #BNBUSDT #DOGEUSDT #PIUSDT
Current price: ~$84,277
Bollinger Bands:
Middle: ~$84,331
Upper: ~$85,100
Lower: ~$83,561
Short-term momentum has weakened
BTC is now slightly below the Bollinger middle band .
That is a change from your previous chart, where BTC was above the middle band.
So short-term momentum has shifted from:
Bullish → Neutral/Bearish
But price is still above the lower Bollinger Band.
Therefore, this is not yet a confirmed major breakdown .
Why did BTC fall from $87K?
This move is not happening in isolation.
BTC reached around $87.3K before pulling back. Recent market reporting links the pullback to rising U.S. Treasury yields, increased expectations for another Fed rate hike, and renewed oil/geopolitical concerns.
This is important because your chart is showing exactly what we would expect from a macro-driven correction:
$87K rejection
↓
risk-off pressure
↓
BTC falls toward $84K
#BTCUSDT #ETHUSDT #BNBUSDT #DOGEUSDT #PIUSDT