Every solar eclipse from 1900 to 2100, rendered as…

0 reactions
Every solar eclipse from 1900 to 2100, rendered as obscuration contours instead of "in or out" corridors
Disclosure first: I'm one of the people behind amCharts. We built this for our DataViz Dojo. Not hiding it.
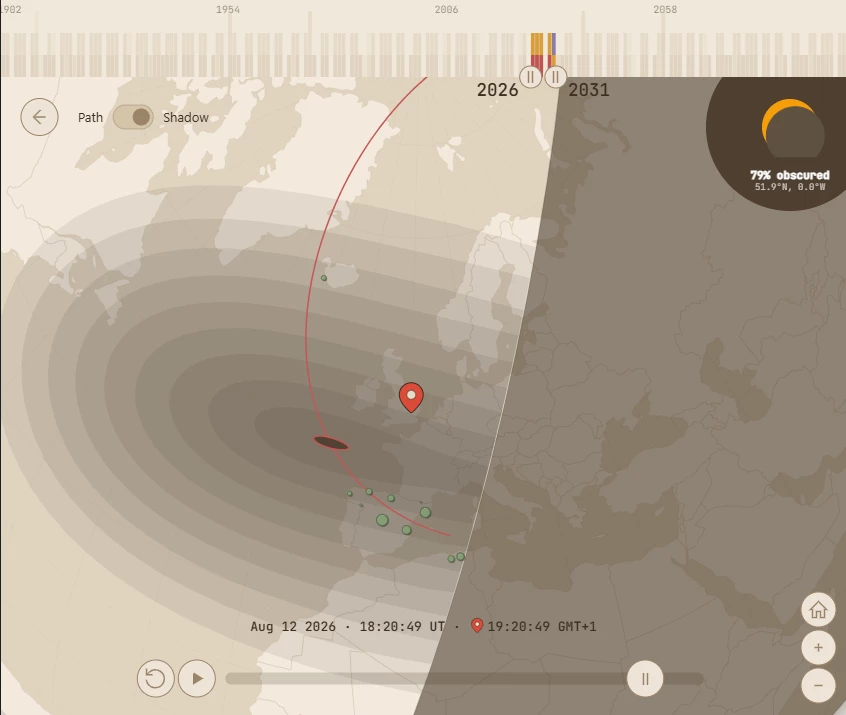
The image shows the August 12, 2026 total eclipse path crossing Iceland, the Iberian Peninsula and Mallorca. The dark band is the umbra (totality), the rings around it are penumbral obscuration contours at 10% steps. Most eclipse maps treat the path as binary: you're in it or you're not. But what people actually want to know is *how much* of the sun gets covered from where they're standing, and that's a continuous field, not a corridor. So we drew it as one.
Data source: Fred Espenak's *Five Millennium Canon of Solar Eclipses* (NASA / GSFC). Geometry computed from the same dataset; observer-pin coverage % derived from it.
Tool: built with amCharts 5 (which is ours, hence the disclosure). The interactive version is free in the browser at https://dojo.amcharts.com/solar-eclipses/ — you can scrub through time to see the shadow move, drop a pin to query exact coverage at coordinates, switch projections, and export your own video.
Wrote up the design reasoning here: https://stack.amcharts.com/p/the-brief-window
The August 2 2027 eclipse over the Sahara is the longest of the century at 6 min 23 sec. The August 12 2026 one (in the image) is the next major total eclipse and is now \~15 weeks away.
#education
source
Disclosure first: I'm one of the people behind amCharts. We built this for our DataViz Dojo. Not hiding it.
The image shows the August 12, 2026 total eclipse path crossing Iceland, the Iberian Peninsula and Mallorca. The dark band is the umbra (totality), the rings around it are penumbral obscuration contours at 10% steps. Most eclipse maps treat the path as binary: you're in it or you're not. But what people actually want to know is *how much* of the sun gets covered from where they're standing, and that's a continuous field, not a corridor. So we drew it as one.
Data source: Fred Espenak's *Five Millennium Canon of Solar Eclipses* (NASA / GSFC). Geometry computed from the same dataset; observer-pin coverage % derived from it.
Tool: built with amCharts 5 (which is ours, hence the disclosure). The interactive version is free in the browser at https://dojo.amcharts.com/solar-eclipses/ — you can scrub through time to see the shadow move, drop a pin to query exact coverage at coordinates, switch projections, and export your own video.
Wrote up the design reasoning here: https://stack.amcharts.com/p/the-brief-window
The August 2 2027 eclipse over the Sahara is the longest of the century at 6 min 23 sec. The August 12 2026 one (in the image) is the next major total eclipse and is now \~15 weeks away.
#education
source


| 1,000 mlx | |
| 3 | |
| 0 |