0 reactions


0 reactions
The mindset of a young woman whose organs continuously escaped her body since age 5.
#fun #education #interesting
#fun #education #interesting
0 reactions
YSK: If your vehicle gets stuck on railroad tracks look for a blue sign. It contains an emergency number and a Crossing ID to immediately halt oncoming trains.
Why YSK: If you call 911 the dispatcher has to figure out exactly where you are and then contact the specific railroad company which takes precious time you might not have. Every railroad crossing has a blue Emergency Notification System sign. If you call the number on that sign and give them the specific alphanumeric Crossing ID you are speaking directly to the railroad's dispatch. They can instantly radio any trains heading toward your exact location to stop potentially saving your life and preventing a massive derailment. Always get everyone out of the car first then make the call.
#education
0 reactions
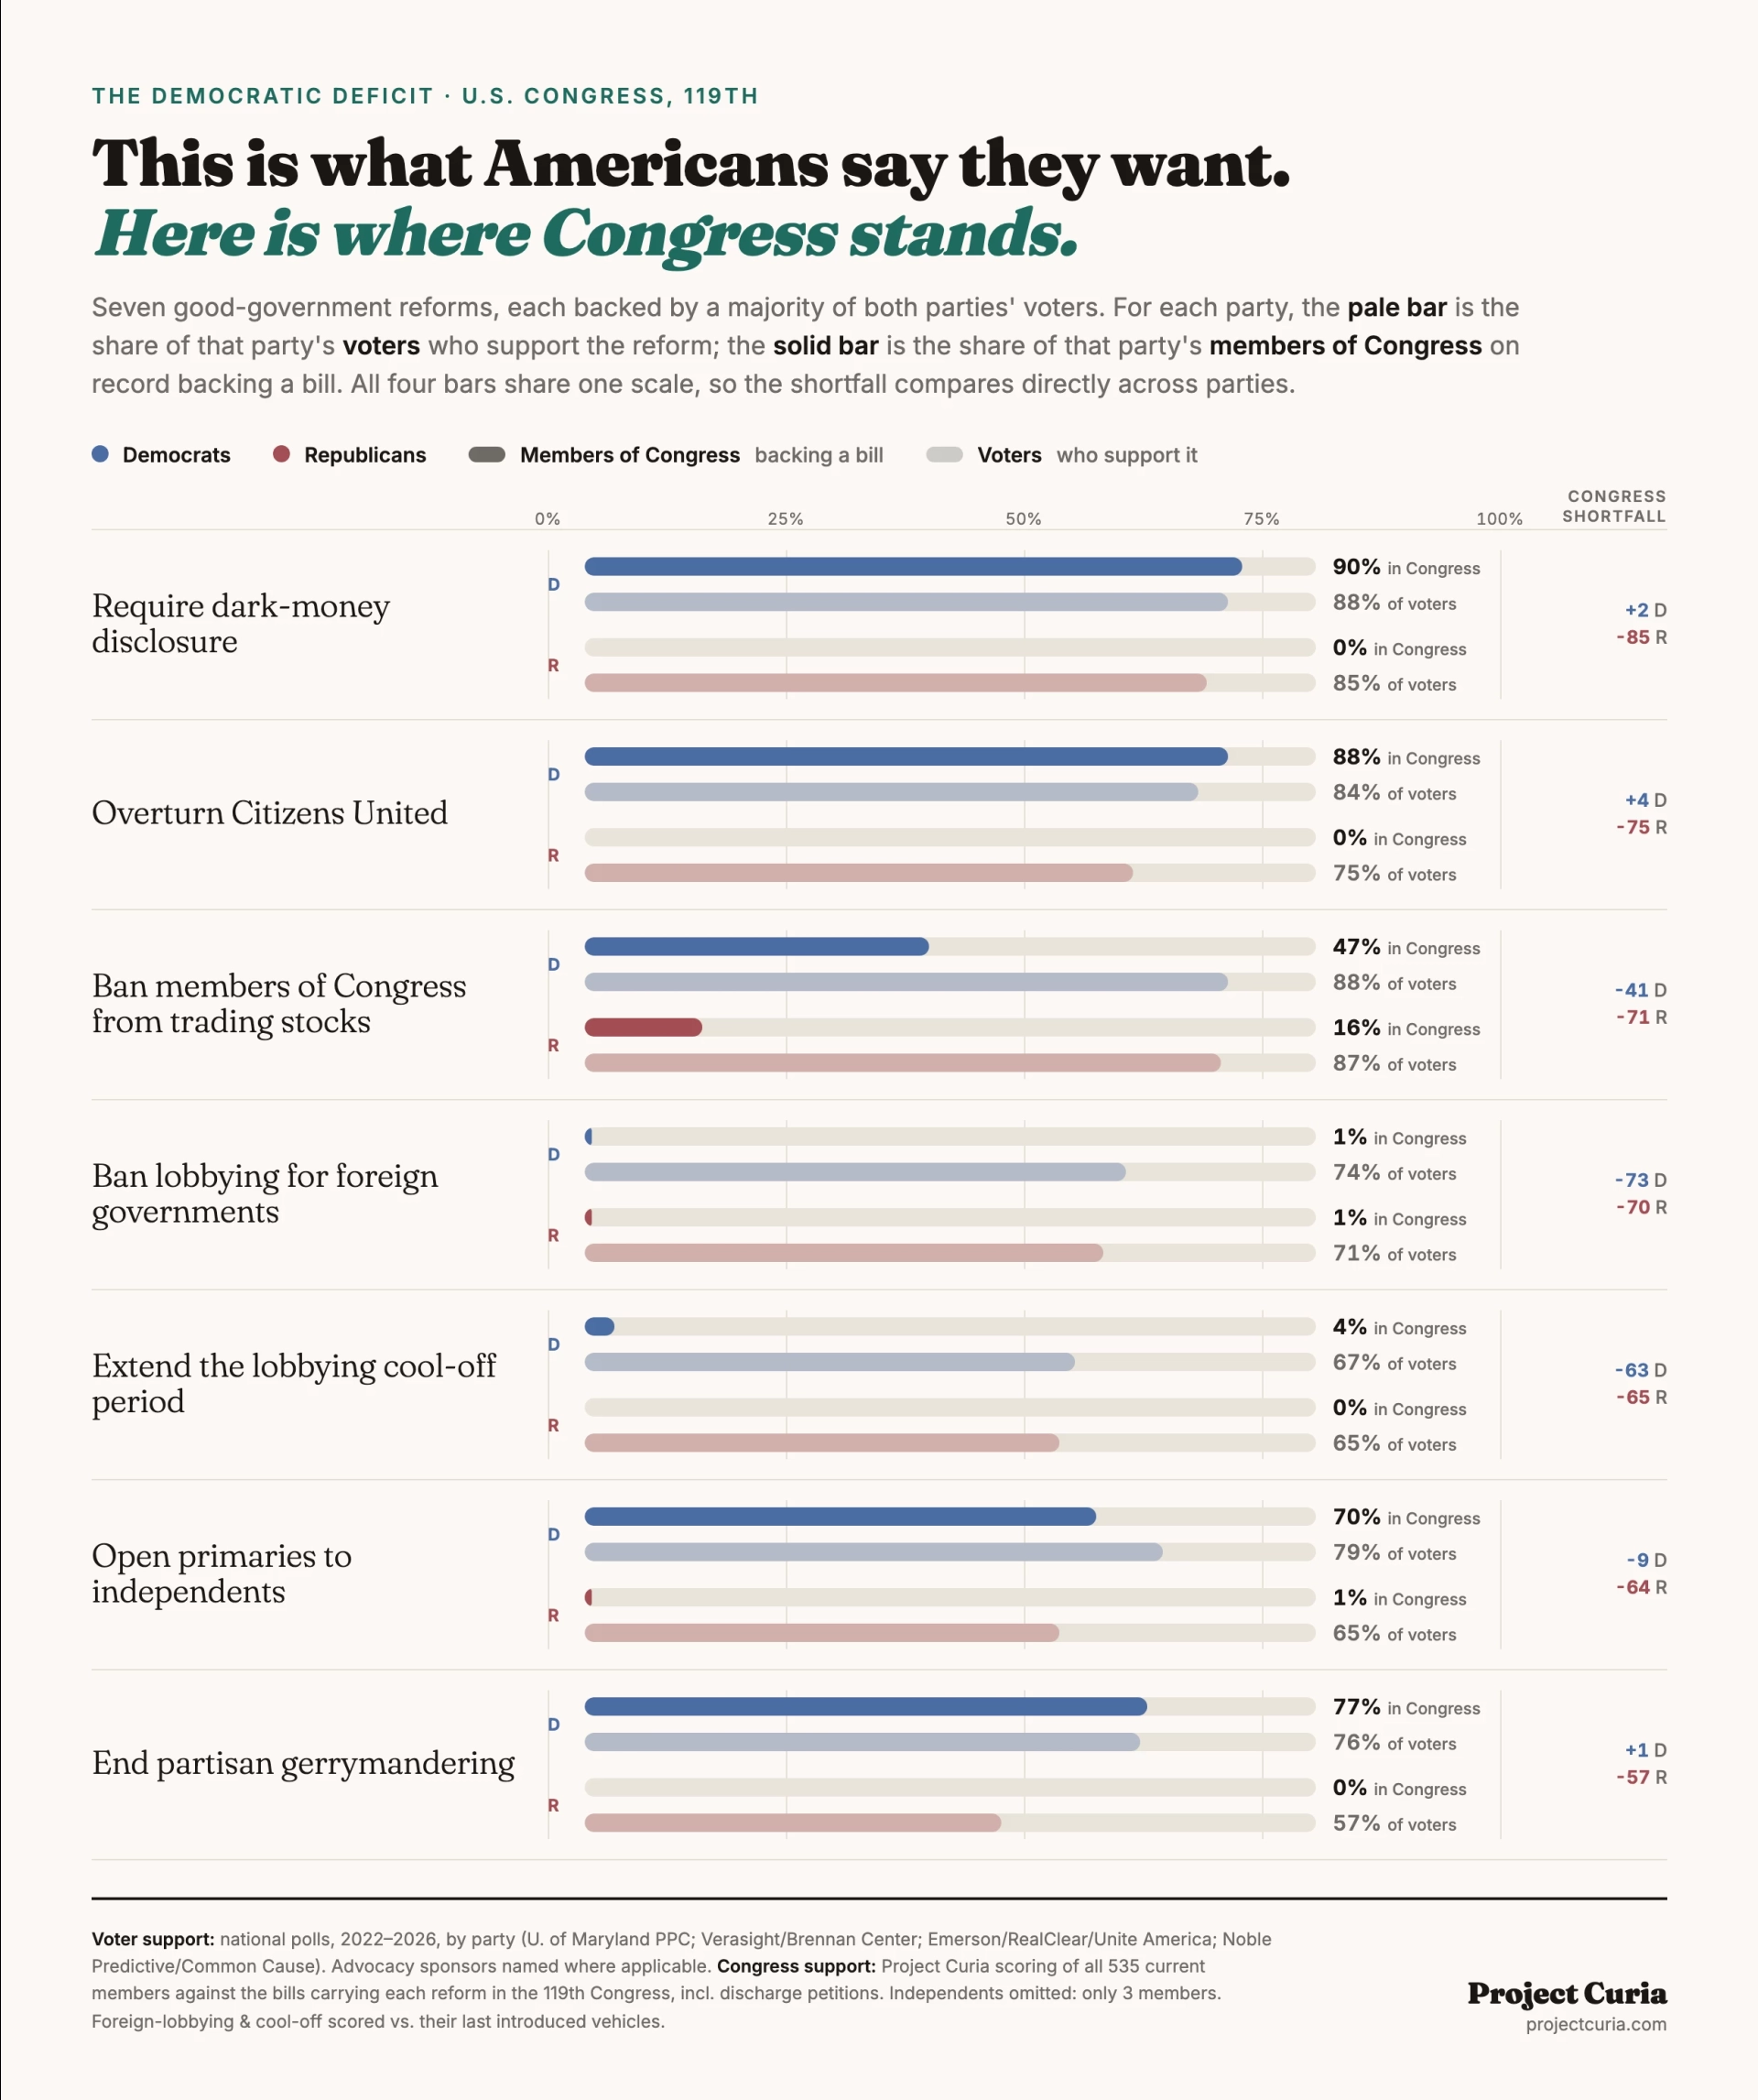
Seven "fix Congress" reforms that majorities of both parties' voters support, and the share of each party's members of Congress actually backing a bill for them
#education
source
#education
source
0 reactions
YSK: If you're baking and something goes wrong, there's a baking hotline you can call for advice
Why ysk: When recipes are unclear, baking goes unexpectedly, or you need help with a baking related situation, it can be overwhelming and confusing but calling +1(855) 371-2253 will connect you with a real person to listen to your baking catastrophe and give you advice.
Here is a link to their website page: https://www.kingarthurbaking.com/bakers-hotline
A woman on the line helped me save my bread.
#education
source
3 reactions
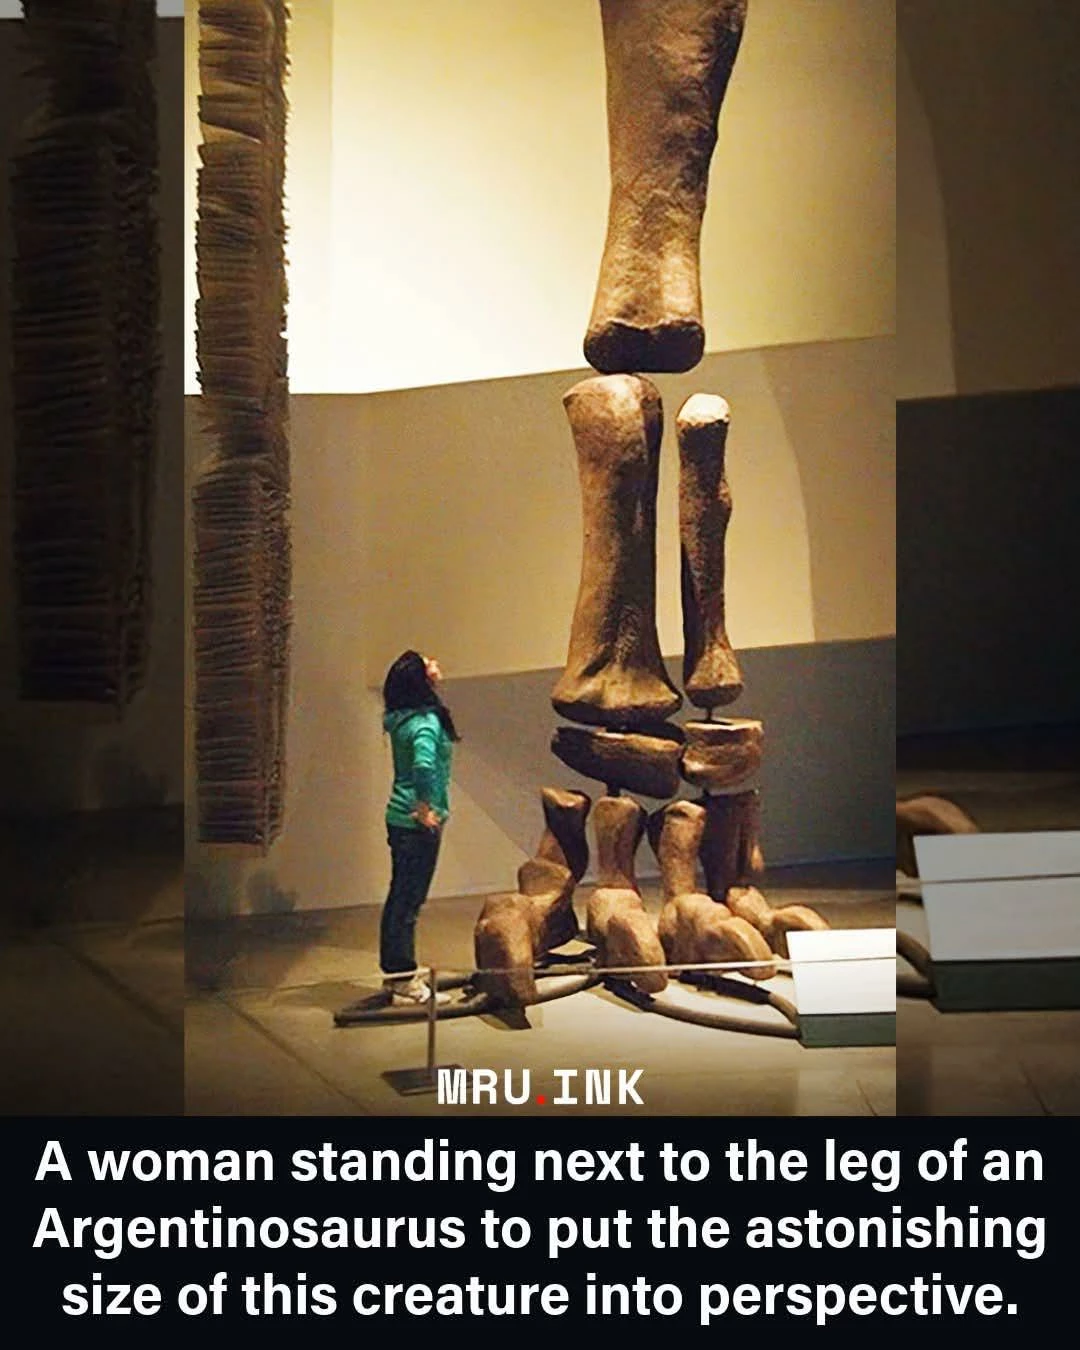
The jaw-dropping scale of Argentinosaurus, one of the largest land animals to ever walk the Earth during the Late Cretaceous period, approximately 97 to 93.5 million years ago. Living in South America this colossal sauropod reached estimated lengths of 100 to 115 feet and weighed up to 90 tons.
#education #fun #interesting
#education #fun #interesting
0 reactions
Each tiny bubble in this Antarctic ice core is a sealed sample of Earth’s atmosphere from thousands of years ago
#education
#education