When the market prices a contract at 70 cents, does the…

0 reactions
When the market prices a contract at 70 cents, does the outcome actually occur ~70% of the time?
What the figure measures:
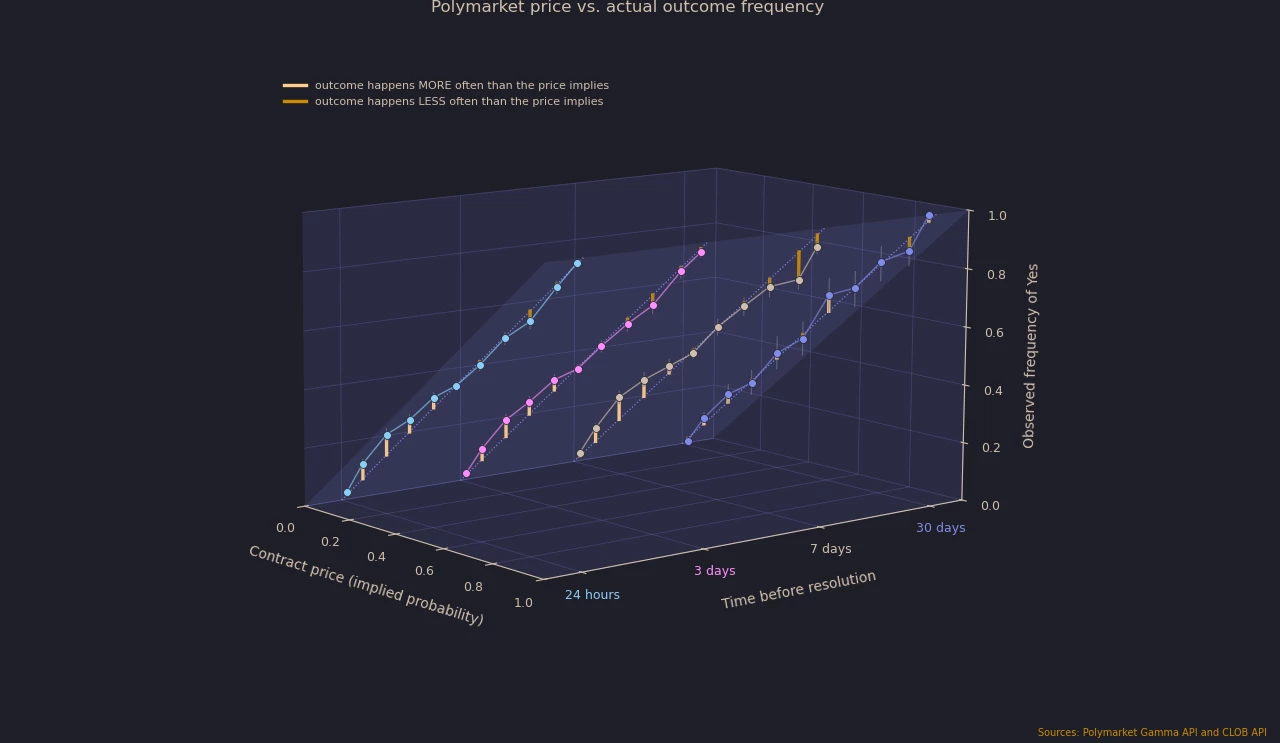
A reliability diagram answers the question: when the market prices a contract at 70 cents, does the outcome actually occur \~70% of the time? The 3D version repeats this comparison at four distances from resolution, to see if the answer changes as the event approaches.
X = price of the "Yes" contract (implied probability)
Y = horizon: 24 h, 3 d, 7 d and 30 d before resolution
Z = observed frequency of "Yes"
Translucent plane z = x = perfect calibration (3D analog of the 45° diagonal). The stems connect each point to the plane and show the calibration deviation, colored by the sign
#education
source
What the figure measures:
A reliability diagram answers the question: when the market prices a contract at 70 cents, does the outcome actually occur \~70% of the time? The 3D version repeats this comparison at four distances from resolution, to see if the answer changes as the event approaches.
X = price of the "Yes" contract (implied probability)
Y = horizon: 24 h, 3 d, 7 d and 30 d before resolution
Z = observed frequency of "Yes"
Translucent plane z = x = perfect calibration (3D analog of the 45° diagonal). The stems connect each point to the plane and show the calibration deviation, colored by the sign
#education
source


| 0 mlx | |
| 2 | |
| 0 |