7 years of EU shipping emissions visualized on a 3D globe…

0 reactions
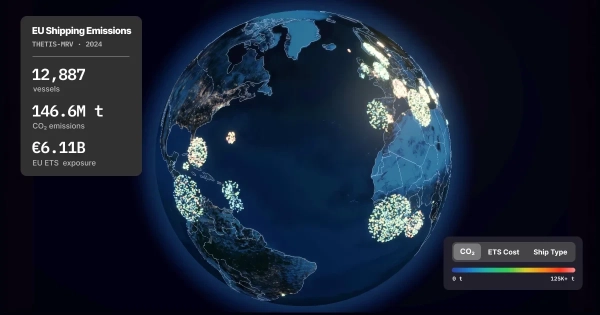
7 years of EU shipping emissions visualized on a 3D globe
Data source: THETIS-MRV, the EU's public ship emissions database maintained by EMSA. Every large ship entering an EU port reports annual CO₂ emissions.
Each dot is a vessel positioned at the country where it's registered (flag state), not where it actually sailed. The biggest clusters are in Panama, Liberia, and the Marshall Islands, the world's largest open registries.
You can search any vessel, filter by ship type or flag state, and switch between CO₂ total, EU ETS cost, and ship type color modes. 2024 is the first year ships had to pay for carbon emissions under EU law.
**Live:** seafloor.pages.dev https://seafloor.pages.dev
**Source:** github.com/marcoshaber99/seafloor https://github.com/marcoshaber99/seafloor
Built with React Three Fiber, Three.js, and Next.js.
#education
source
Data source: THETIS-MRV, the EU's public ship emissions database maintained by EMSA. Every large ship entering an EU port reports annual CO₂ emissions.
Each dot is a vessel positioned at the country where it's registered (flag state), not where it actually sailed. The biggest clusters are in Panama, Liberia, and the Marshall Islands, the world's largest open registries.
You can search any vessel, filter by ship type or flag state, and switch between CO₂ total, EU ETS cost, and ship type color modes. 2024 is the first year ships had to pay for carbon emissions under EU law.
**Live:** seafloor.pages.dev https://seafloor.pages.dev
**Source:** github.com/marcoshaber99/seafloor https://github.com/marcoshaber99/seafloor
Built with React Three Fiber, Three.js, and Next.js.
#education
source


| 1,000 mlx | |
| 3 | |
| 0 |