Assets over the past decade controlling for inflation Just…

0 reactions
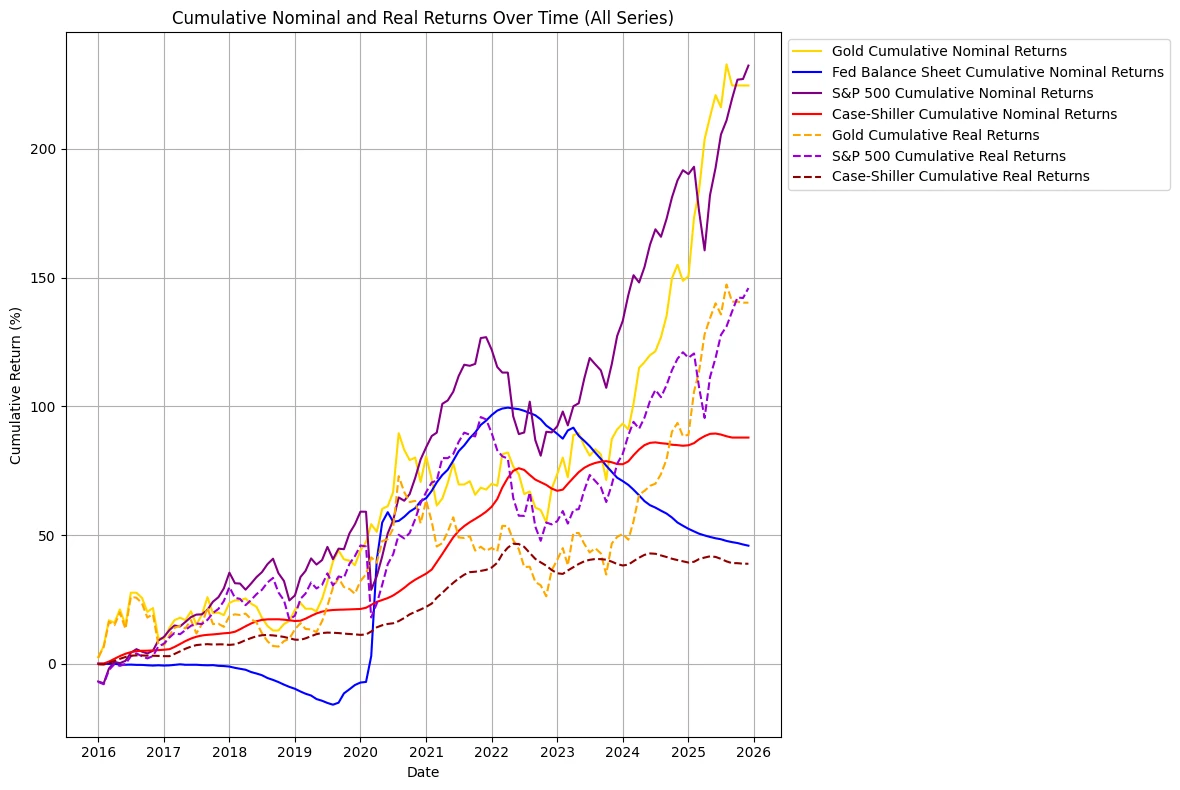
Assets over the past decade controlling for inflation
Just ran some analysis and this was one image I thought you all may be interested in...
Individual Series Trends
* **Gold Price Index**: Showed a general upward trend over the period, with notable periods of significant increases, especially during times of economic uncertainty, but also experienced corrections.
* **Federal Reserve Balance Sheet**: Exhibited substantial growth, particularly after the 2020 crisis, indicating expansionary monetary policy. More recently, it showed periods of stagnation or slight decline, suggesting a shift towards quantitative tightening or slower growth.
* **CPI (Inflation)**: Maintained a relatively stable, upward trajectory for most of the period, with a more pronounced acceleration in recent years (post-2020), indicating higher inflationary pressures.
* **US 10-Year Treasury Yield**: Showed significant fluctuations, with a general decline in the earlier part of the period followed by a notable rise and recent stabilization, reflecting changes in monetary policy expectations and economic conditions.
* **S&P 500**: Demonstrated strong long-term growth with significant rallies and corrections, reflecting overall stock market performance and economic cycles.
**Case-Shiller Home Price Index**: Showed a consistent and strong upward trend, particularly accelerating post-2020, indicating a robust housing market.
"**(Source) All data are from FRED:**
\- gold by using the data on FRED for "Import Price Index (End Use): Nonmonetary Gold (IR14270)", located at (https://fred.stlouisfed.org/series/IR14270).
\- Fed ballance sheet, "Assets: Total Assets: Total Assets (Less Eliminations from Consolidation): Wednesday Level (WALCL)", located at (https://fred.stlouisfed.org/series/WALCL)
\- inflation using Consumer Price Index: Consumer Price Index for All Urban Consumers: All Items Less Food and Energy in U.S. City Average (CPILFESL), located at (https://fred.stlouisfed.org/series/CPILFESL)
\- S&P 500 (SP500), located at (https://fred.stlouisfed.org/series/SP500)
\- S&P Cotality Case-Shiller U.S. National Home Price Index (CSUSHPINSA), located at (https://fred.stlouisfed.org/series/CSUSHPINSA)
\- US 10 year treasury yield "Market Yield on U.S. Treasury Securities at 10-Year Constant Maturity, Quoted on an Investment Basis (DGS10)", located at (https://fred.stlouisfed.org/series/DGS10)
* The tool used to generate the visual **(Tool):**
Python via google collab notebooks."
#education
source
Just ran some analysis and this was one image I thought you all may be interested in...
Individual Series Trends
* **Gold Price Index**: Showed a general upward trend over the period, with notable periods of significant increases, especially during times of economic uncertainty, but also experienced corrections.
* **Federal Reserve Balance Sheet**: Exhibited substantial growth, particularly after the 2020 crisis, indicating expansionary monetary policy. More recently, it showed periods of stagnation or slight decline, suggesting a shift towards quantitative tightening or slower growth.
* **CPI (Inflation)**: Maintained a relatively stable, upward trajectory for most of the period, with a more pronounced acceleration in recent years (post-2020), indicating higher inflationary pressures.
* **US 10-Year Treasury Yield**: Showed significant fluctuations, with a general decline in the earlier part of the period followed by a notable rise and recent stabilization, reflecting changes in monetary policy expectations and economic conditions.
* **S&P 500**: Demonstrated strong long-term growth with significant rallies and corrections, reflecting overall stock market performance and economic cycles.
**Case-Shiller Home Price Index**: Showed a consistent and strong upward trend, particularly accelerating post-2020, indicating a robust housing market.
"**(Source) All data are from FRED:**
\- gold by using the data on FRED for "Import Price Index (End Use): Nonmonetary Gold (IR14270)", located at (https://fred.stlouisfed.org/series/IR14270).
\- Fed ballance sheet, "Assets: Total Assets: Total Assets (Less Eliminations from Consolidation): Wednesday Level (WALCL)", located at (https://fred.stlouisfed.org/series/WALCL)
\- inflation using Consumer Price Index: Consumer Price Index for All Urban Consumers: All Items Less Food and Energy in U.S. City Average (CPILFESL), located at (https://fred.stlouisfed.org/series/CPILFESL)
\- S&P 500 (SP500), located at (https://fred.stlouisfed.org/series/SP500)
\- S&P Cotality Case-Shiller U.S. National Home Price Index (CSUSHPINSA), located at (https://fred.stlouisfed.org/series/CSUSHPINSA)
\- US 10 year treasury yield "Market Yield on U.S. Treasury Securities at 10-Year Constant Maturity, Quoted on an Investment Basis (DGS10)", located at (https://fred.stlouisfed.org/series/DGS10)
* The tool used to generate the visual **(Tool):**
Python via google collab notebooks."
#education
source


| 3,000 mlx | |
| 3 | |
| 0 |