I built a live solar-storm tracker — here's a replay of…

0 reactions
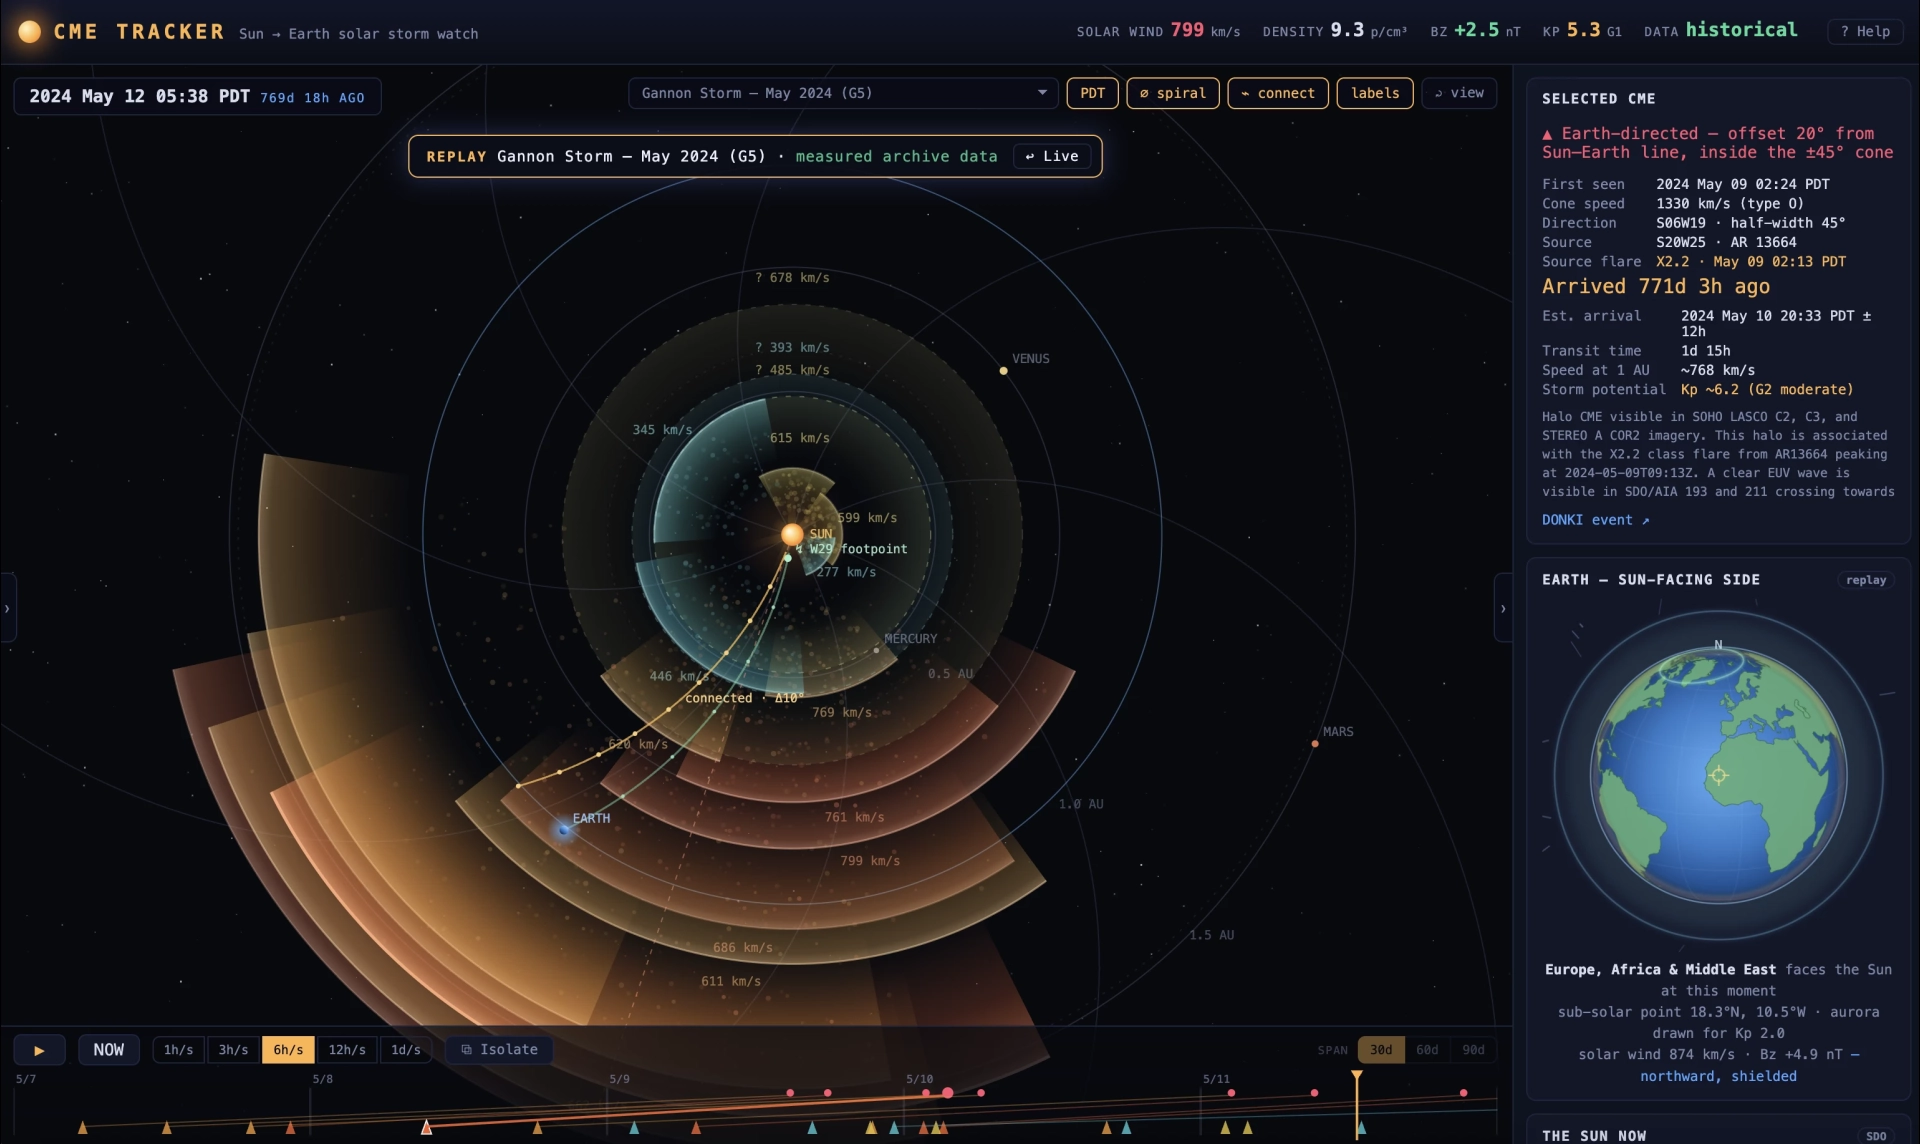
I built a live solar-storm tracker — here's a replay of the May 2024 "Gannon" storm that brought auroras down to ~20° latitude
This is the May 10–11, 2024 geomagnetic storm, the strongest in about 20 years, replayed in a live space-weather visualizer I made ( https://cmetracker.ai ).
What you're watching: a coronal mass ejection (CME), a cloud of magnetized plasma, launching from the Sun and sweeping past Earth. The spiral is the Sun's magnetic field dragged outward by the solar wind (the "Parker spiral").
Data (all public, real-time feeds):
* NASA DONKI — CME & solar-flare catalog
* NOAA SWPC — solar wind measured by the DSCOVR & ACE spacecraft at L1, plus the Kp index
* NASA SDO — solar disk imagery
* NASA OMNI / CDAWeb — the historical solar-wind record that drives storm replays like this one
What it's trying to show, beyond a pretty animation:
* How long a CME takes to cross the \~150 million km to Earth (modeled with simple drag physics)
* Why size isn't everything — a storm only hits hard if the CME's magnetic field points south, against Earth's
* Which magnetic field lines actually connect the Sun to us
Gannon pushed visible auroras down to \~20° latitude: Mexico, Puerto Rico, northern India (far below where they normally appear.)
#education
source
This is the May 10–11, 2024 geomagnetic storm, the strongest in about 20 years, replayed in a live space-weather visualizer I made ( https://cmetracker.ai ).
What you're watching: a coronal mass ejection (CME), a cloud of magnetized plasma, launching from the Sun and sweeping past Earth. The spiral is the Sun's magnetic field dragged outward by the solar wind (the "Parker spiral").
Data (all public, real-time feeds):
* NASA DONKI — CME & solar-flare catalog
* NOAA SWPC — solar wind measured by the DSCOVR & ACE spacecraft at L1, plus the Kp index
* NASA SDO — solar disk imagery
* NASA OMNI / CDAWeb — the historical solar-wind record that drives storm replays like this one
What it's trying to show, beyond a pretty animation:
* How long a CME takes to cross the \~150 million km to Earth (modeled with simple drag physics)
* Why size isn't everything — a storm only hits hard if the CME's magnetic field points south, against Earth's
* Which magnetic field lines actually connect the Sun to us
Gannon pushed visible auroras down to \~20° latitude: Mexico, Puerto Rico, northern India (far below where they normally appear.)
#education
source


| 4,000 mlx | |
| 9 | |
| 0 |