I simulated 10,000 stock price paths using Monte Carlo +…

0 reactions
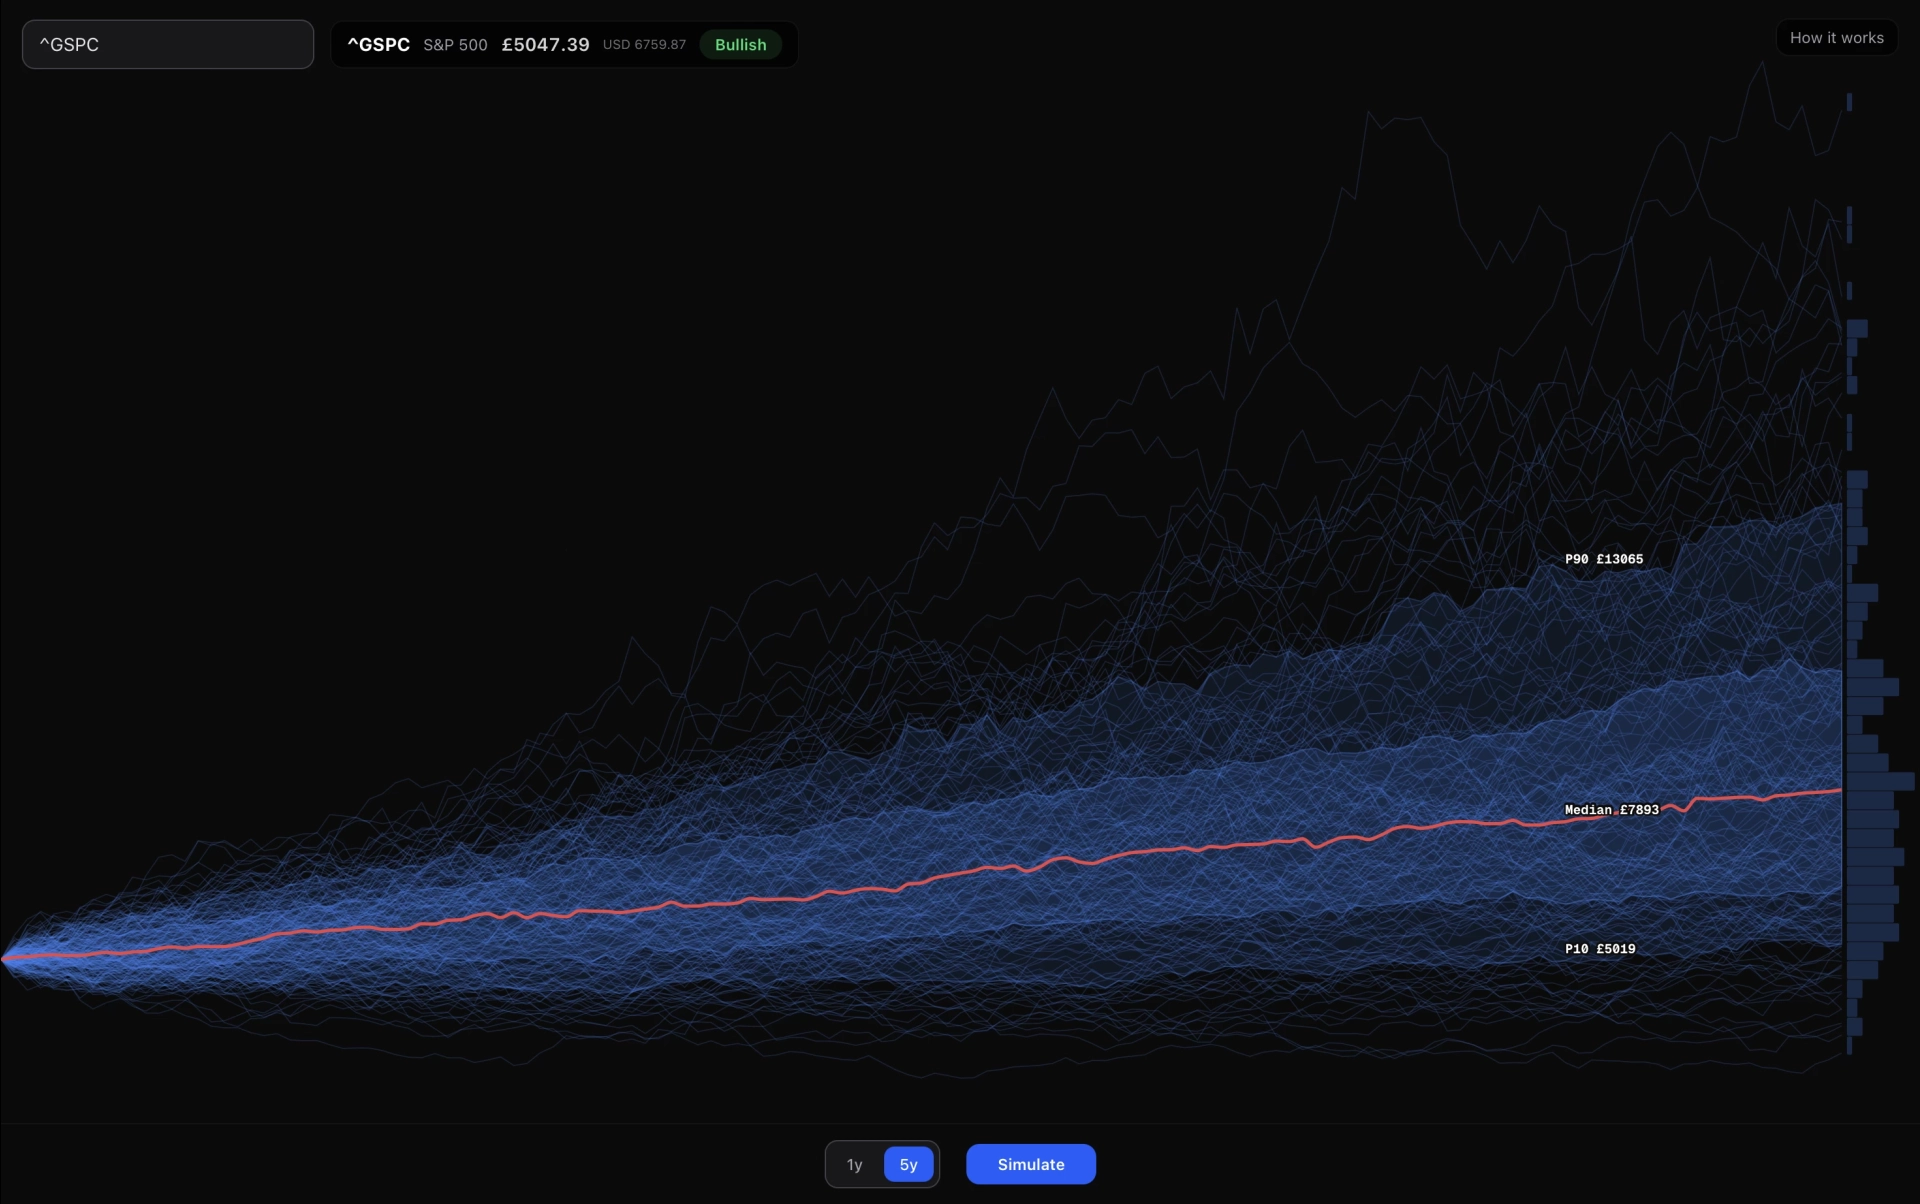
I simulated 10,000 stock price paths using Monte Carlo + Geometric Brownian Motion
Each line is a possible future for the S&P500 over the next five years, modelled using Geometric Brownian Motion with historical volatility and drift.
Built this as a free interactive tool so anyone can run their own simulations. Drop a ticker, adjust volatility and time horizon, and watch the paths generate in real time.
Tool: monte.rorymurray.uk http://monte.rorymurray.uk
Happy to answer questions on the GBM model or the math behind it.
#education
source
Each line is a possible future for the S&P500 over the next five years, modelled using Geometric Brownian Motion with historical volatility and drift.
Built this as a free interactive tool so anyone can run their own simulations. Drop a ticker, adjust volatility and time horizon, and watch the paths generate in real time.
Tool: monte.rorymurray.uk http://monte.rorymurray.uk
Happy to answer questions on the GBM model or the math behind it.
#education
source


| 2,000 mlx | |
| 4 | |
| 0 |