0 reactions
How does the risk of death change as we age — and how has this changed over time?
The day a child is born is the most dangerous day of life.
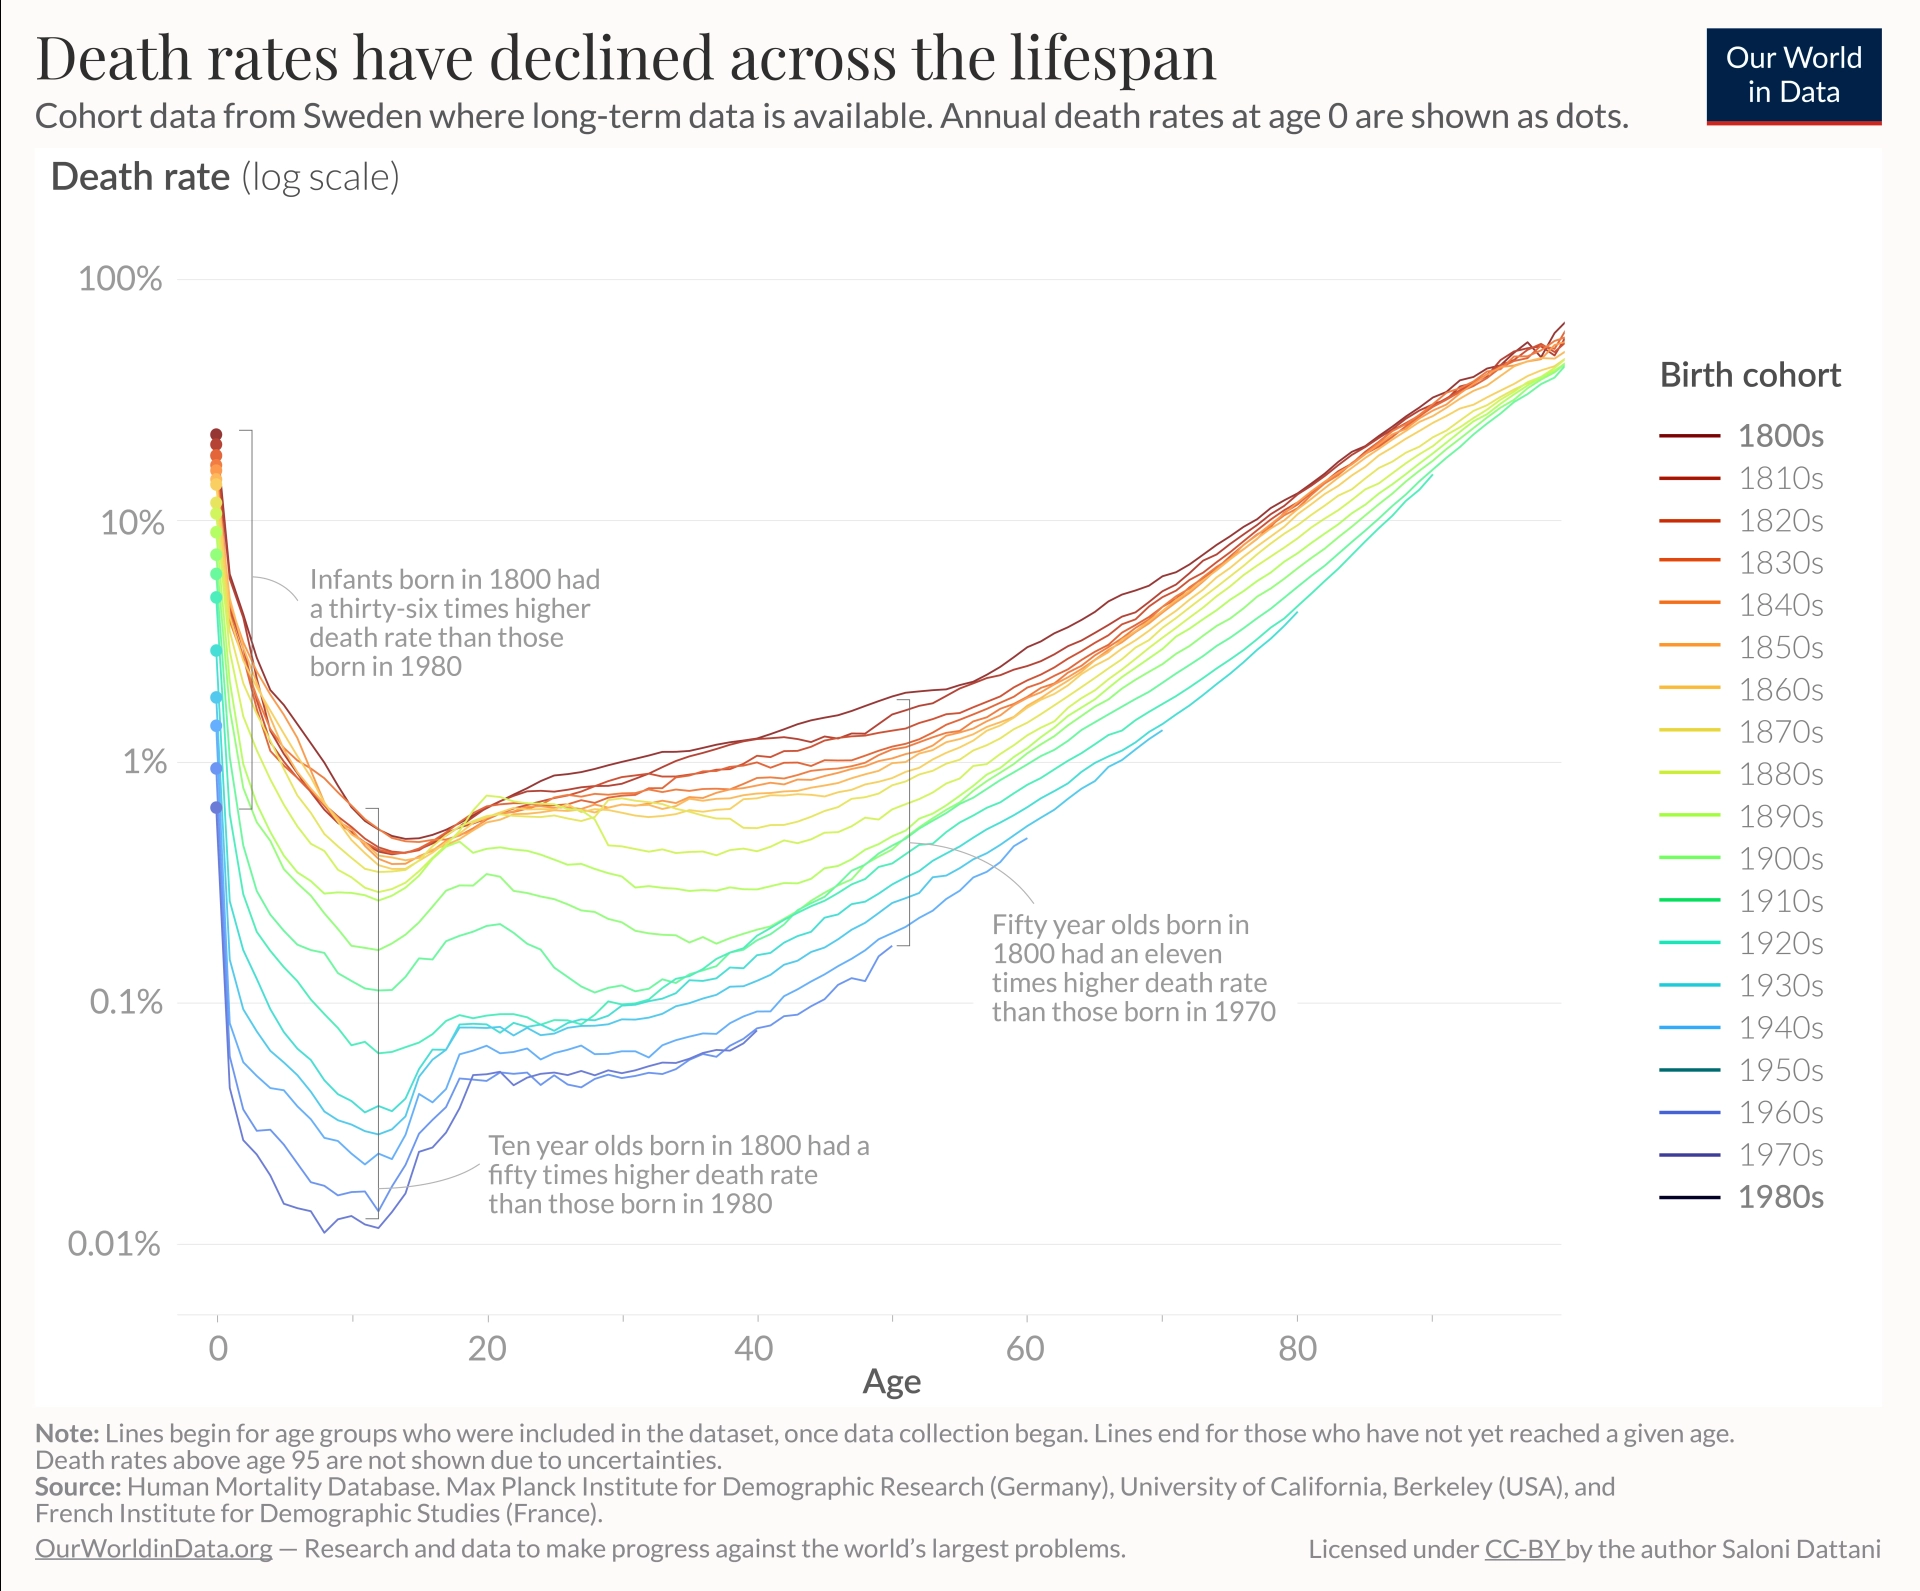
After birth, a child’s risk of dying declines rapidly across the first year of life. Risks continue to decline over the next few years, but suddenly rise again during adolescence. Finally, in adulthood, the chances of dying grow exponentially.
If you plot the risk of dying against age, it looks like a J-shaped curve or a hook. You can see this in the chart.
Across a historical timeframe, however, the whole curve has shifted downwards — the annual rates of death have declined across all age groups.
You can see this by the different colored lines in the chart, which represent birth cohorts going back to 1800.
**Data source:** Human Mortality Database https://www.mortality.org/ (2023)
**Tools used:** OWID Grapher and Figma
#education
source
The day a child is born is the most dangerous day of life.
After birth, a child’s risk of dying declines rapidly across the first year of life. Risks continue to decline over the next few years, but suddenly rise again during adolescence. Finally, in adulthood, the chances of dying grow exponentially.
If you plot the risk of dying against age, it looks like a J-shaped curve or a hook. You can see this in the chart.
Across a historical timeframe, however, the whole curve has shifted downwards — the annual rates of death have declined across all age groups.
You can see this by the different colored lines in the chart, which represent birth cohorts going back to 1800.
**Data source:** Human Mortality Database https://www.mortality.org/ (2023)
**Tools used:** OWID Grapher and Figma
#education
source


| 4,000 mlx | |
| 4 | |
| 0 |
0 comments