
3 reactions
U.S. Financial Stress and Market Volatility Since 1994
**Data Source: Federal Reserve Bank of St. Louis (FRED) — VIXCLS (****https://fred.stlouisfed.org/series/VIXCLS** htt https://fred.stlouisfed.org/series/VIXCLS & STLFSI2 (****https://fred.stlouisfed.org/series/STLFSI2** htt https://fred.stlouisfed.org/series/STLFSI2 | Tools: R, tidyverse, ggplot2**
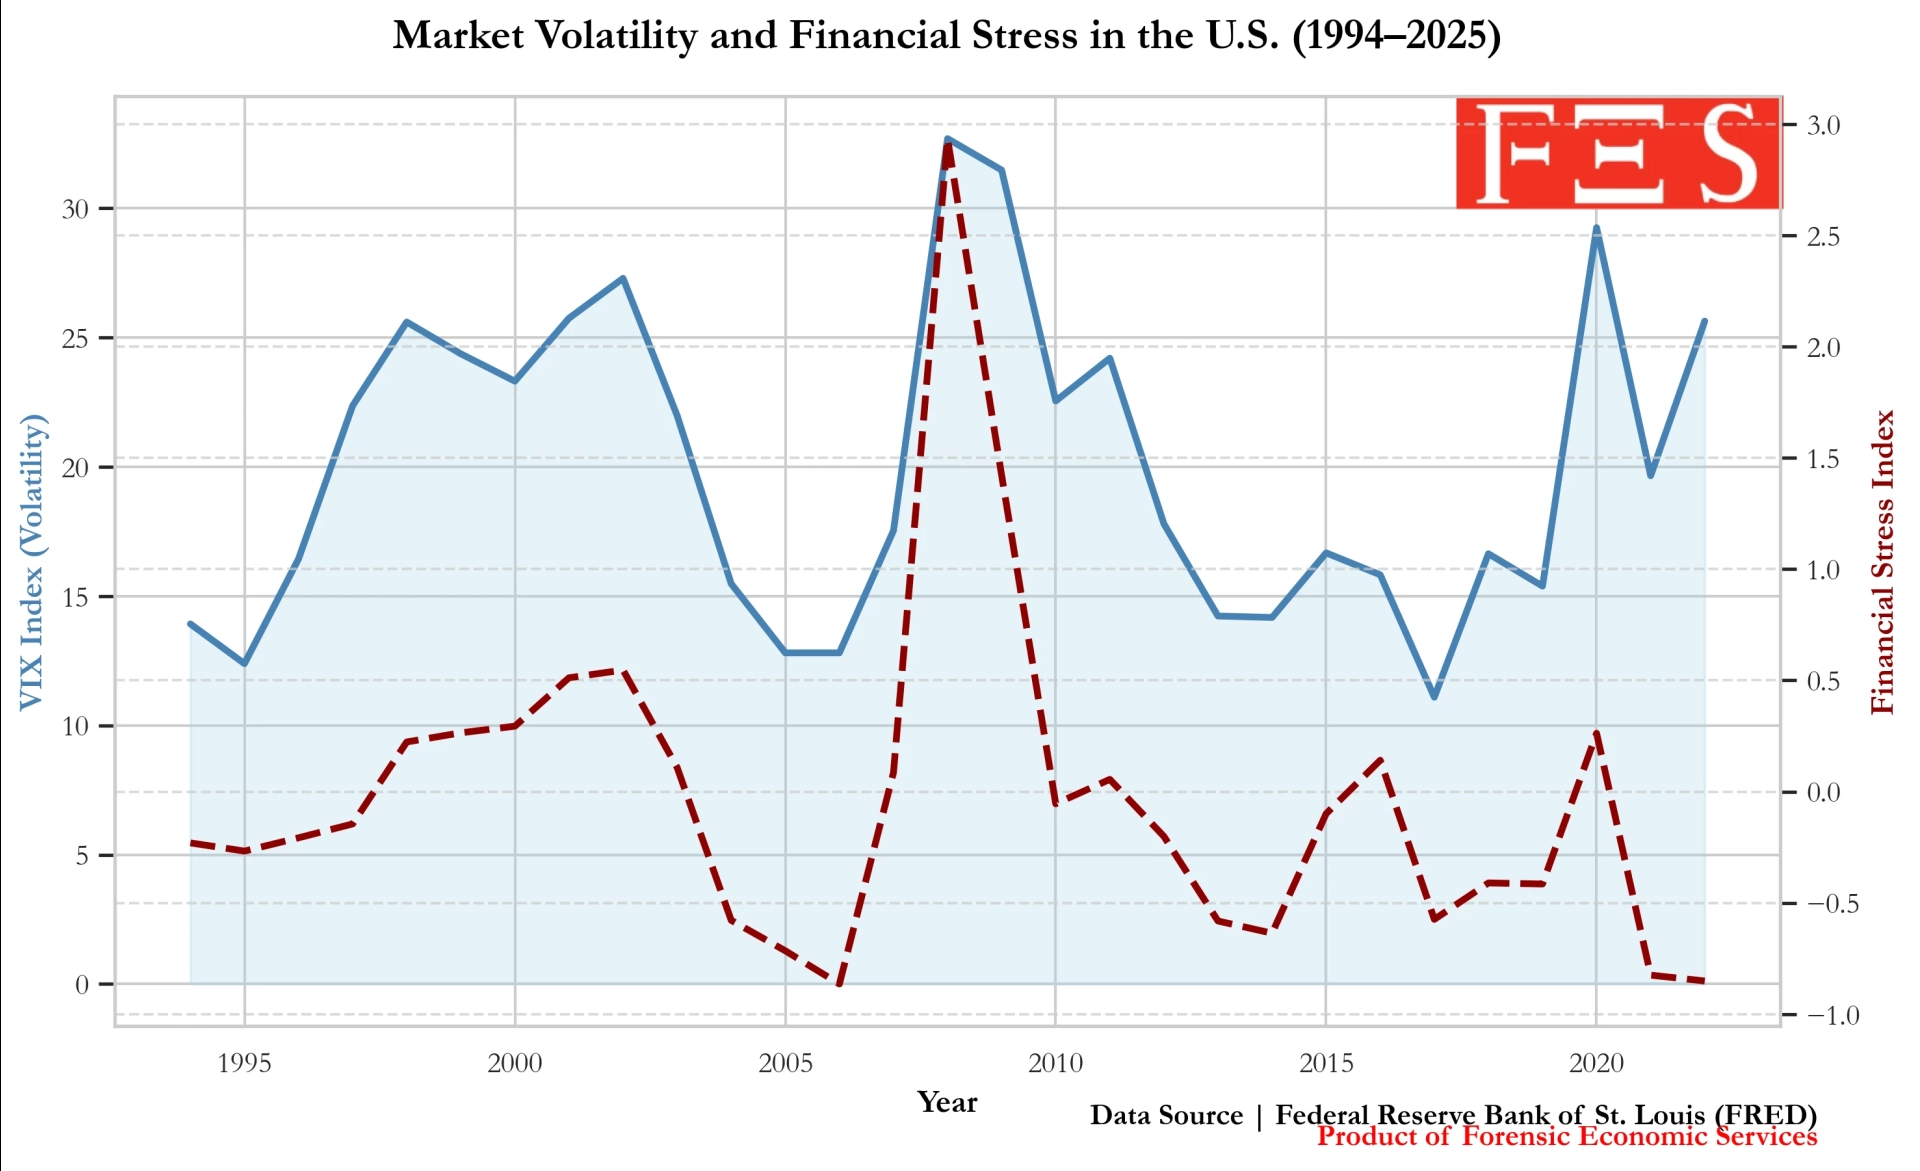
This visualization compares the *CBOE Volatility Index (VIX)* with the *St. Louis Financial Stress Index (STLFSI)* from 1994 through 2025.
**Series Used:**
* **VIXCLS** — CBOE Volatility Index
* **STLFSI2** — St. Louis Fed Financial Stress Index
The VIX reflects expected stock-market volatility, while the STLFSI summarizes 18 financial indicators related to funding, credit, and market stress.
A few patterns that stand out:
* **2008–2009:** Both volatility and overall stress spike dramatically during the Global Financial Crisis.
* **2020:** Volatility surges during the onset of COVID-19, but financial stress rises less sharply due to rapid policy intervention.
* **Post-2020:** Financial stress falls below zero (below-average), while volatility remains more erratic.
Data were pulled directly from FRED using the API and aggregated into annual averages for clarity.
Happy to share the R code if anyone wants it.
#education
source
**Data Source: Federal Reserve Bank of St. Louis (FRED) — VIXCLS (****https://fred.stlouisfed.org/series/VIXCLS** htt https://fred.stlouisfed.org/series/VIXCLS & STLFSI2 (****https://fred.stlouisfed.org/series/STLFSI2** htt https://fred.stlouisfed.org/series/STLFSI2 | Tools: R, tidyverse, ggplot2**
This visualization compares the *CBOE Volatility Index (VIX)* with the *St. Louis Financial Stress Index (STLFSI)* from 1994 through 2025.
**Series Used:**
* **VIXCLS** — CBOE Volatility Index
* **STLFSI2** — St. Louis Fed Financial Stress Index
The VIX reflects expected stock-market volatility, while the STLFSI summarizes 18 financial indicators related to funding, credit, and market stress.
A few patterns that stand out:
* **2008–2009:** Both volatility and overall stress spike dramatically during the Global Financial Crisis.
* **2020:** Volatility surges during the onset of COVID-19, but financial stress rises less sharply due to rapid policy intervention.
* **Post-2020:** Financial stress falls below zero (below-average), while volatility remains more erratic.
Data were pulled directly from FRED using the API and aggregated into annual averages for clarity.
Happy to share the R code if anyone wants it.
#education
source


| 7,000 mlx | |
| 7 | |
| 3 |