Vehicle sold at action vs JD Power Benchmark Trying to…

0 reactions
Vehicle sold at action vs JD Power Benchmark
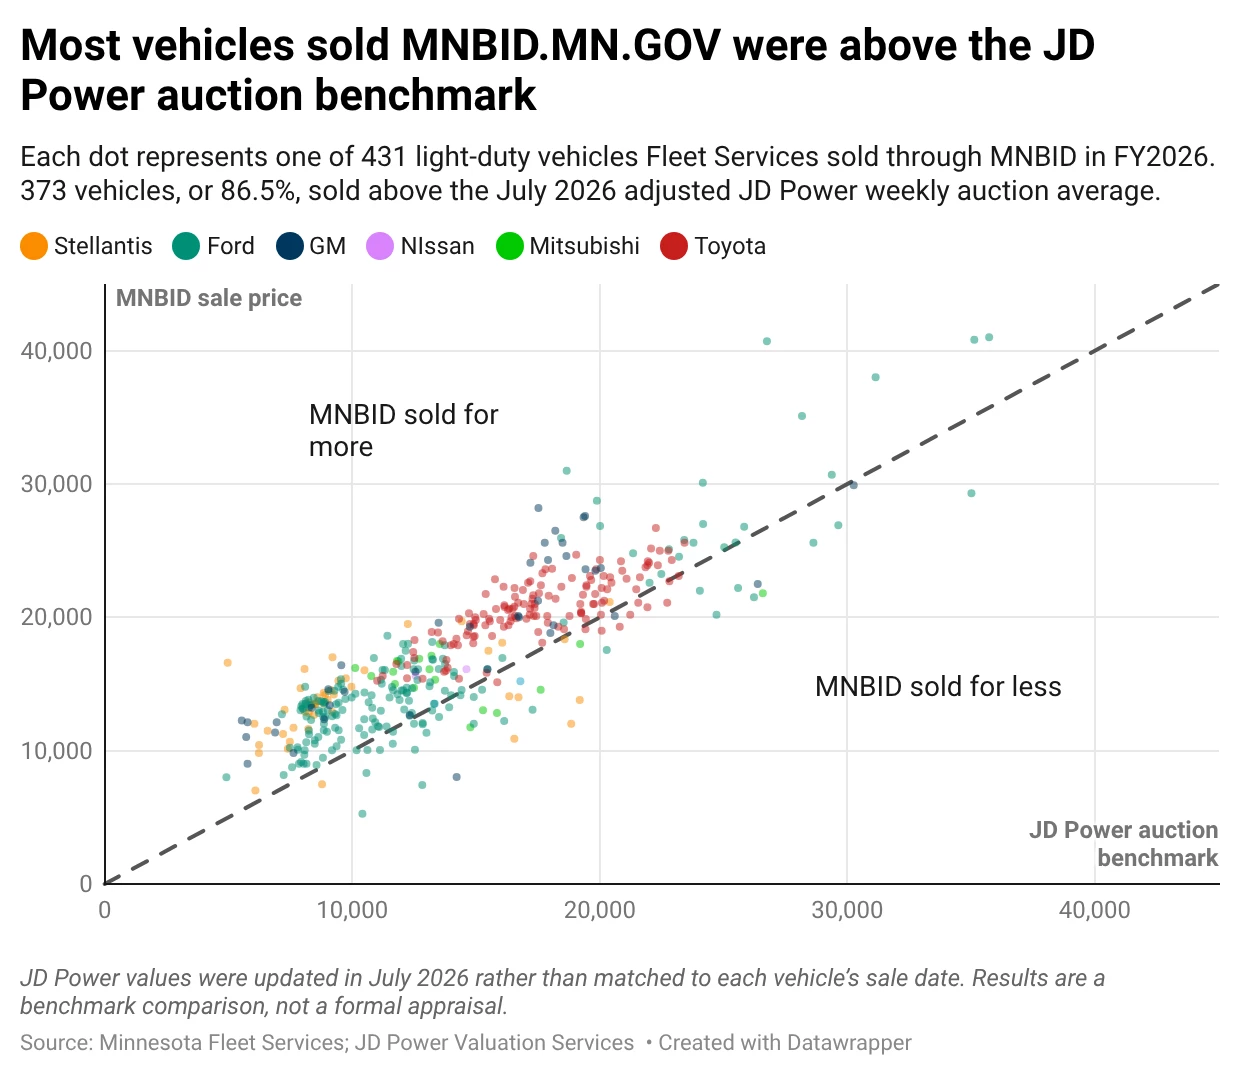
Trying to prove we have the best state run action website with my second visual of the week. Thanks for everyone's input on the first one.
https://www.datawrapper.de/\_/qapEp/ https://www.datawrapper.de/_/qapEp/ If you hover over a dot, it will isolate all those OEMs, show you the sale price, J.D. Power estimate and mileage.
This visual covers the 431 light-duty vehicles sold by Minnesota Department of Administration Fleet last fiscal year and compares their sale prices with the J.D. Power auction benchmark. The comparison has a limitation: I only had access to J.D. Power data for the final month of the fiscal year, while the vehicles were sold throughout the 12-month period. Because vehicles depreciate over time, applying the year-end benchmark to vehicles sold earlier in the year likely overstates how much their sale prices exceeded the benchmark. So basically, I'm tooting our horn softer...
Why did the Transit Vans go for so much? Delivery vans after COVID were in big demand. We had them and so they went for more. If I had enough data on box trucks and delivery vans, I'd like to make a visual showing how the demand affects the price of those.
Open to questions and feedback.
#education
source
Trying to prove we have the best state run action website with my second visual of the week. Thanks for everyone's input on the first one.
https://www.datawrapper.de/\_/qapEp/ https://www.datawrapper.de/_/qapEp/ If you hover over a dot, it will isolate all those OEMs, show you the sale price, J.D. Power estimate and mileage.
This visual covers the 431 light-duty vehicles sold by Minnesota Department of Administration Fleet last fiscal year and compares their sale prices with the J.D. Power auction benchmark. The comparison has a limitation: I only had access to J.D. Power data for the final month of the fiscal year, while the vehicles were sold throughout the 12-month period. Because vehicles depreciate over time, applying the year-end benchmark to vehicles sold earlier in the year likely overstates how much their sale prices exceeded the benchmark. So basically, I'm tooting our horn softer...
Why did the Transit Vans go for so much? Delivery vans after COVID were in big demand. We had them and so they went for more. If I had enough data on box trucks and delivery vans, I'd like to make a visual showing how the demand affects the price of those.
Open to questions and feedback.
#education
source


| 2,000 mlx | |
| 2 | |
| 0 |