I made an interactive map of how close houses are to roads…

0 reactions
I made an interactive map of how close houses are to roads
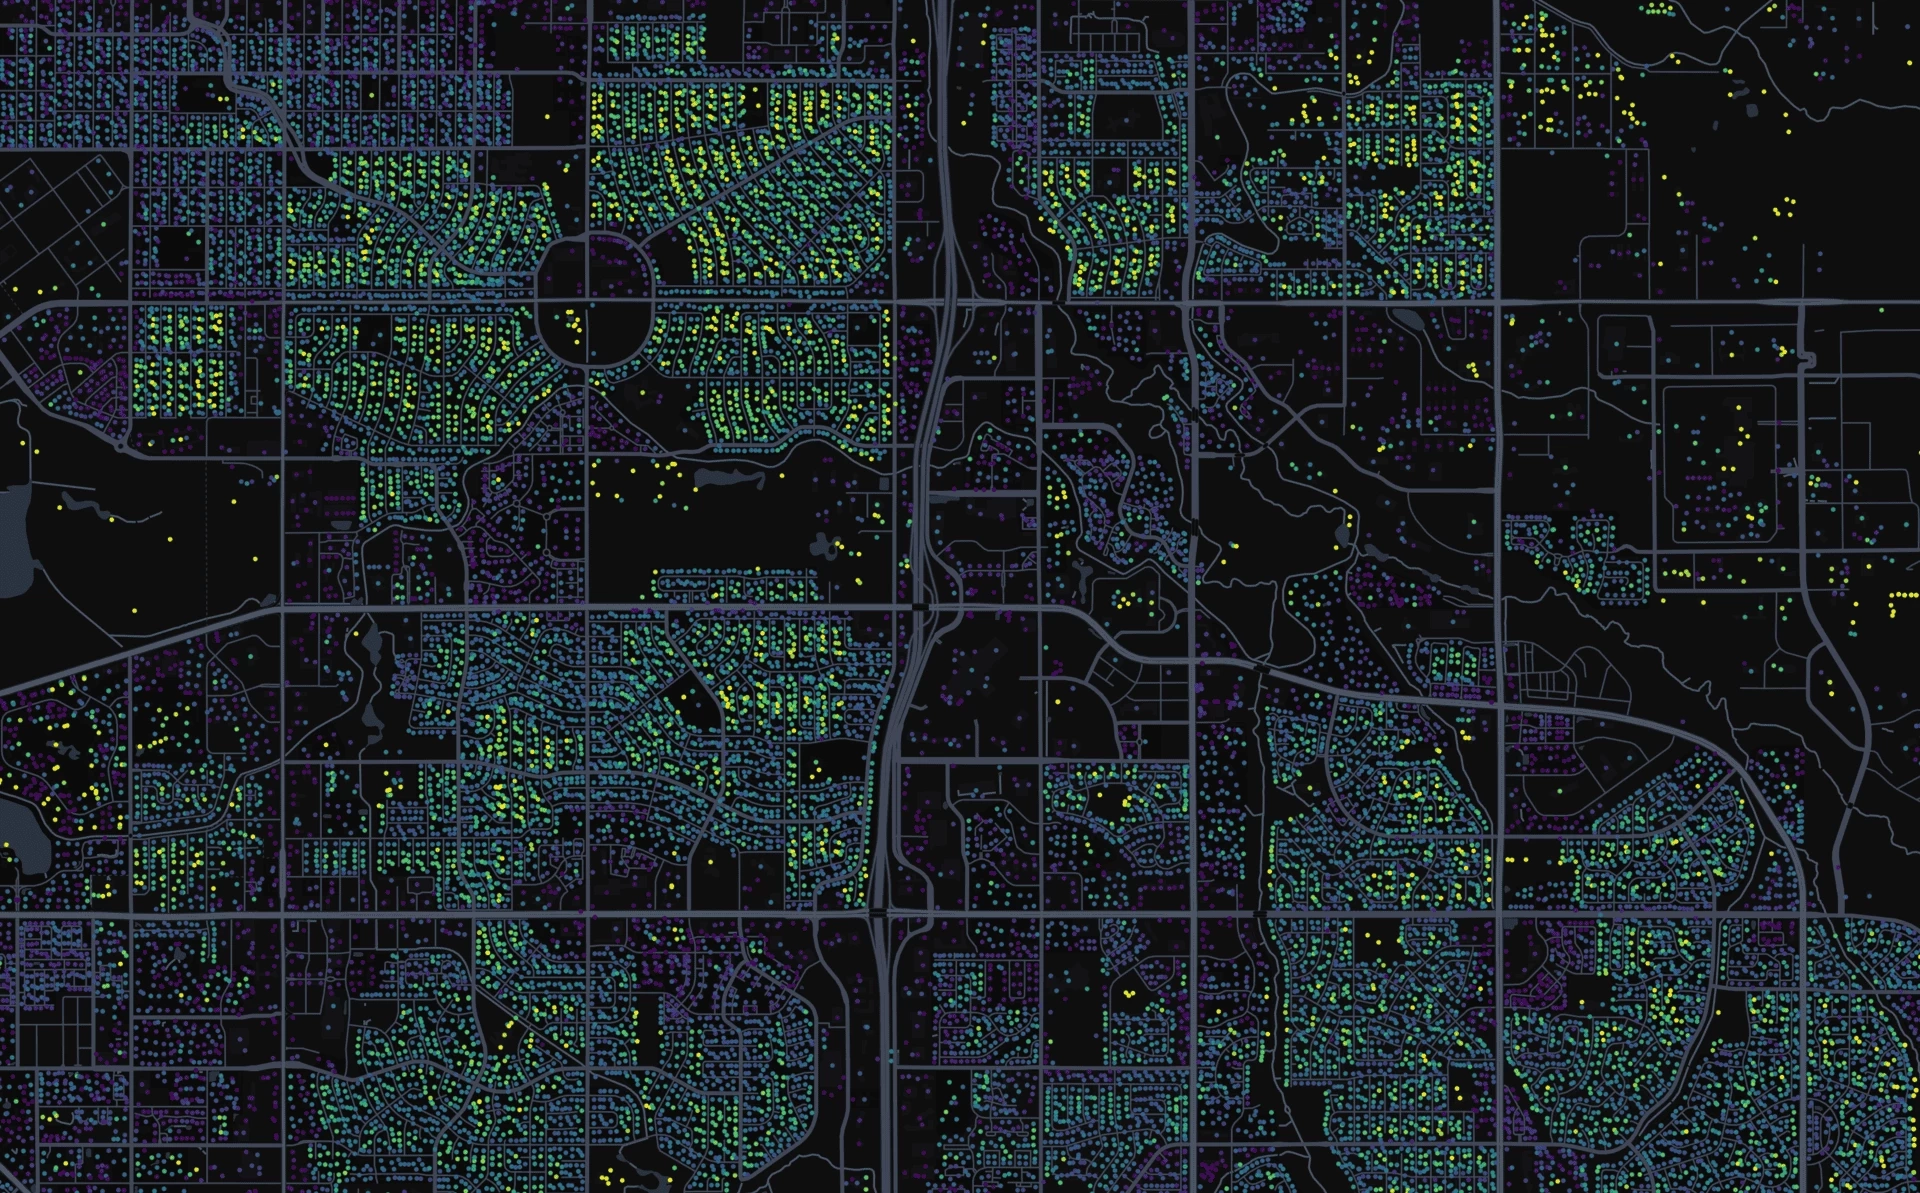
I built a small website that shows the distance between house walls and the nearest road, using OSM data.
*Data-processing (Rust + python):*
* I read building and road data from .osm.pbf files
* For each building wall vertex, I compute the distance to the nearest driveable road
* I write that whole data into two .geojson files (per-wall file for lower LODs, and average point per-house file for higher LODs)
* I convert those .geojsons into .pmtiles using tippecanoe
*Rendering (Deckgl + MapLibre):*
* I color the building walls by distance
* At low zoom, it shows one dot per building/cluster
* At high zoom, it shows detailed wall segments
*Data source*: OpenStreetMap
Happy to discuss and read ideas, this is my first public project and will certainly not be the last one.
Link: https://byjtew.github.io/house\_to\_street https://byjtew.github.io/house_to_street
#education
source
I built a small website that shows the distance between house walls and the nearest road, using OSM data.
*Data-processing (Rust + python):*
* I read building and road data from .osm.pbf files
* For each building wall vertex, I compute the distance to the nearest driveable road
* I write that whole data into two .geojson files (per-wall file for lower LODs, and average point per-house file for higher LODs)
* I convert those .geojsons into .pmtiles using tippecanoe
*Rendering (Deckgl + MapLibre):*
* I color the building walls by distance
* At low zoom, it shows one dot per building/cluster
* At high zoom, it shows detailed wall segments
*Data source*: OpenStreetMap
Happy to discuss and read ideas, this is my first public project and will certainly not be the last one.
Link: https://byjtew.github.io/house\_to\_street https://byjtew.github.io/house_to_street
#education
source


| 2,000 mlx | |
| 2 | |
| 0 |